

Key takeaways
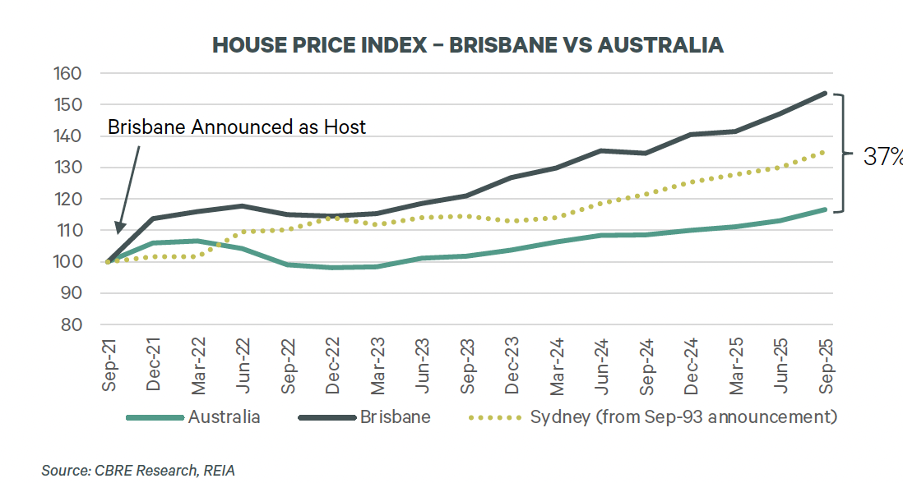
Brisbane has delivered extraordinary growth since the 2021 Olympic announcement - house prices are already 37% above the national average, exceeding Sydney's spread before the 2000 Games.
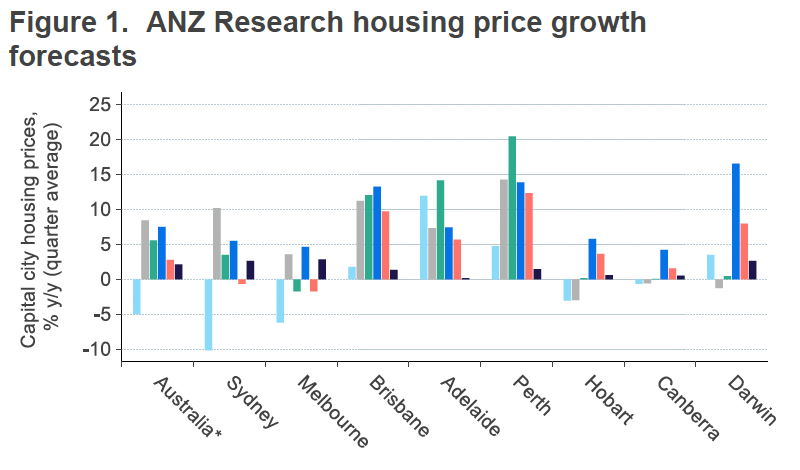
ANZ Research forecasts Brisbane to grow 9.7% in 2026, one of the strongest performances of any capital city - but growth is expected to moderate significantly to 1.4% in 2027 as affordability constraints bite.
That slowdown in 2027 is not a crisis - it's a normal phase of the cycle after five years of exceptional gains. The structural case for Brisbane over the next decade remains very strong.
Across every Olympic host city since 1996, residential prices grew faster in the four years after the Games (averaging 42.5%) than in the four years leading up to them (23.3%) - and Brisbane's fundamentals today mirror Sydney's before 2000.
The $7.1 billion infrastructure program and construction pipeline will constrain new residential supply right through to 2031, keeping vacancy rates near 1.0% and underpinning long-term rental and capital growth.
Inner and middle-ring suburbs with genuine owner-occupier appeal, proximity to Olympic precincts, and access to Cross River Rail remain the strongest long-term positions for strategic investors.
Brisbane has quietly become one of Australia’s most exciting property stories — a city transforming from the underdog of the east coast into a powerhouse of growth, lifestyle, and opportunity.
While Sydney and Melbourne often steal the headlines, Brisbane has been outperforming expectation delivering steady, sustainable growth, and it’s not slowing down.
With record migration, billions of dollars in infrastructure spending, and the 2032 Olympic Games on the horizon, the River City is entering what could be its golden decade.
That doesn't mean Brisbane's growth will continue at the same pace it has. After five extraordinary years, some moderation is inevitable - and the latest ANZ Research forecast reflects that.
ANZ expects Brisbane to grow 9.7% in 2026, before slowing to 1.4% in 2027 as affordability constraints tighten and higher interest rates work their way through the market.
That's a normal phase of the cycle, and it doesn't change Brisbane's underlying investment case one bit.
What it does mean is that investors need to be even more strategic about what they buy and where, because in a slower-growth environment, the quality of the individual asset matters even more than it did when the whole city was rising.
In this detailed article, I’ll walk you through:
-
Why Brisbane’s property market is poised for another strong upswing.
-
The demographic and economic forces driving long-term demand.
-
The types of properties most likely to outperform in this cycle.
-
And finally, how we at Metropole can help you make smarter, safer investment decisions to grow, protect, and pass on your wealth.
If you’re looking for clarity in the chaos — and a proven way to profit from Brisbane’s next growth wave — you’re in the right place.
Here is the latest data on the median property prices for Brisbane.
| Property | Median price | Δ MoM | Δ QoQ | Δ Annual |
|---|---|---|---|---|
| All Capital city dwellings | $1,116,180 | 1.2% | 4.7% | 19.7% |
| Capital city houses | $1,222,906 | 1.2% | 4.5% | 19.1% |
| Capital city units | $876,474 | 1.4% | 5.5% | 22.6% |
| Regional dwellings | $839,458 | 1.4% | 4.0% | 14.7% |
Source: Cotality, 1st May 2026
Here's the forecast for Brisbane property prices in 2026
The most current forecast data is from ANZ Research's April 2026 update, and for Brisbane it tells a story of two very different years.
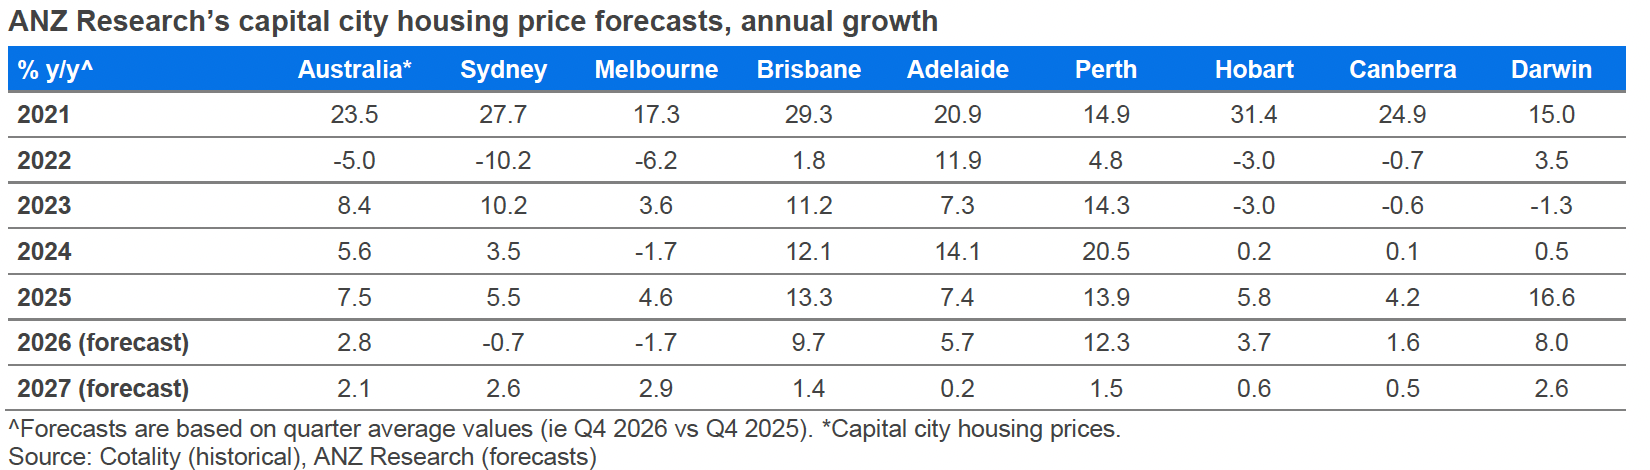
To put that in context, Brisbane has grown 12.1%, 13.3%, and then 9.7% in three consecutive years.
By any measure, that is an exceptional run, meaning some consolidation in 2027 is not just unsurprising - it's healthy.
It doesn't mean Brisbane stops being one of Australia's most compelling long-term investment markets. It means investors should be thinking about the decade ahead, not just the next twelve months.
And when you look at what that decade holds, the picture is genuinely exciting.
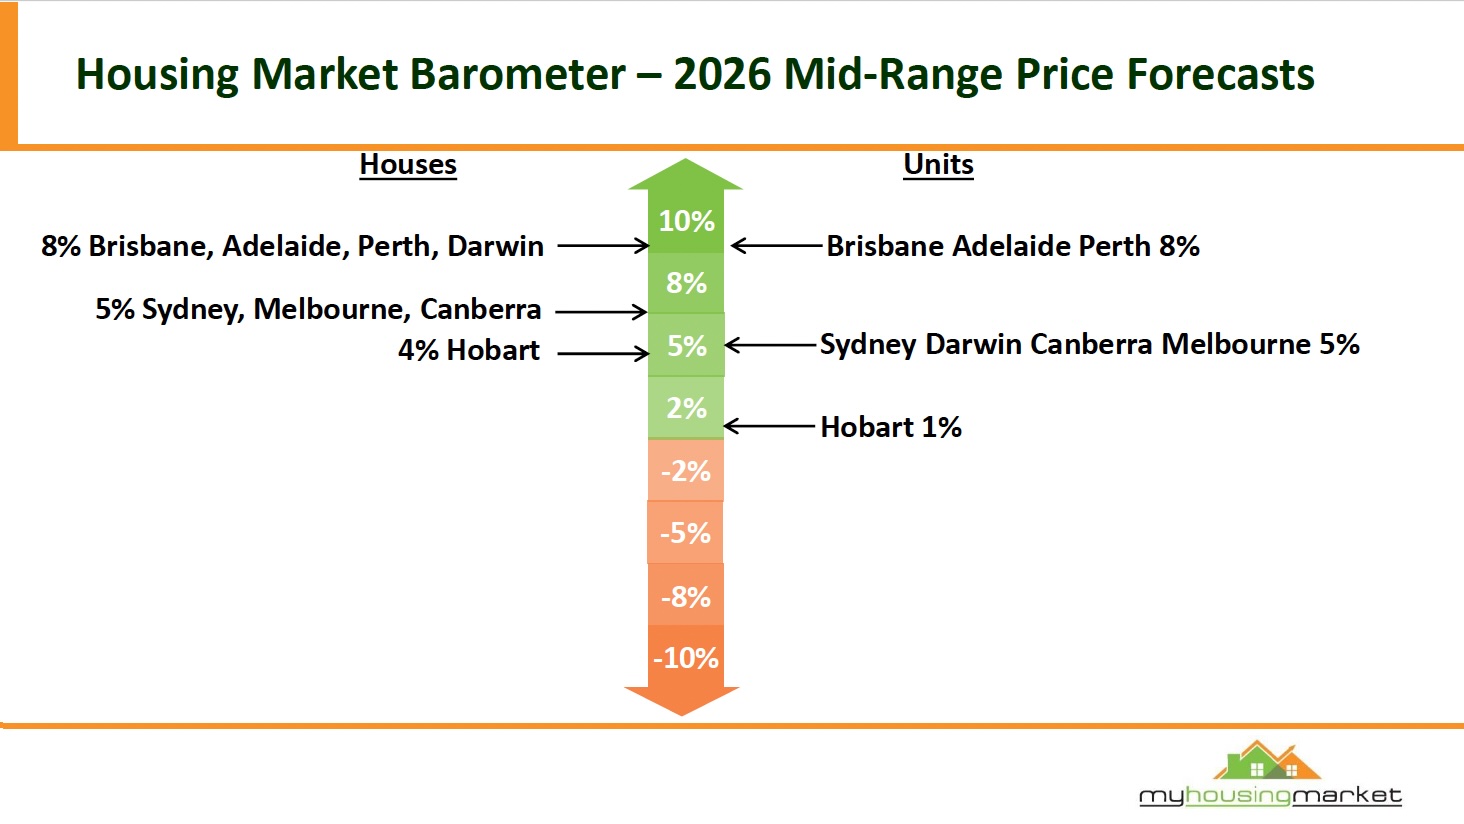
And here are Australia's leading housing economist, Dr. Andrew Wilson's forecasts for 2026.
The Olympics decade, why Brisbane's best years are still to come.
Since the announcement of the Olympics hosting in 2021, Brisbane's house price index has already risen 37% above the national average.
That's a bigger spread than Sydney managed in the same timeframe, and the infrastructure build hasn't even properly started yet.
CBRE research also examined what happened to residential prices in the four years following the Games in every host city since 1996.
The average price growth in the four years post-Olympics was 42.5%, compared to 23.3% in the four years leading up to the event.
Olympic host cities, on average, grew faster after the Games than before them.
This is the most underappreciated data point in the entire Brisbane investment conversation, and it directly addresses the "post-Olympics bust" fear that holds some investors back.
Here's what's actually being built:
A lot of investors get caught up in the headline number - $7.1 billion for venues - without understanding what that money is actually doing to the city's fabric.
There is the new 63,000-seat stadium at Victoria Park (earthworks mid-2026), the Athletes Village at Bowen Hills converting to residential post-Games, the National Aquatics Centre at Spring Hill, and Cross River Rail threading it all together.
This is much more than just temporary infrastructure - most of it has been deliberately designed for legacy use.
The supply squeeze:
Queensland construction costs are up 44% over five years.
As the Olympics build ramps up from late 2026 through to mid-2031, construction capacity that might otherwise go into residential development will get absorbed into the Olympics pipeline.
CBRE forecasts just 3,100 new inner-city dwellings will be built each year from 2026 to 2031, which is well below the demand implied by Brisbane's population growth. this has led to vacancy rate forecasts remaining at or below 1.0% until at least 2031.
But be careful ... while the Olympics will provide a tailwind, it's not an investment thesis in itself. Good property investment is still about buying the right asset in the right location with genuine owner-occupier appeal. The Games will just accelerate what was already happening
Brisbane rents set to surge
Median apartment rents are likely to grow by 24% between 2025 and 2030 across Australian capital cities, according to the latest report by International Property Consultancy, CBRE.
CBRE estimates Brisbane apartment delivery to average 4,600 per annum over 2025-2030. Demand for housing stock (apartments and communities) is likely to average 16,000 p.a., which will drive down city-wide vacancy from 1.1% to 0.7%.
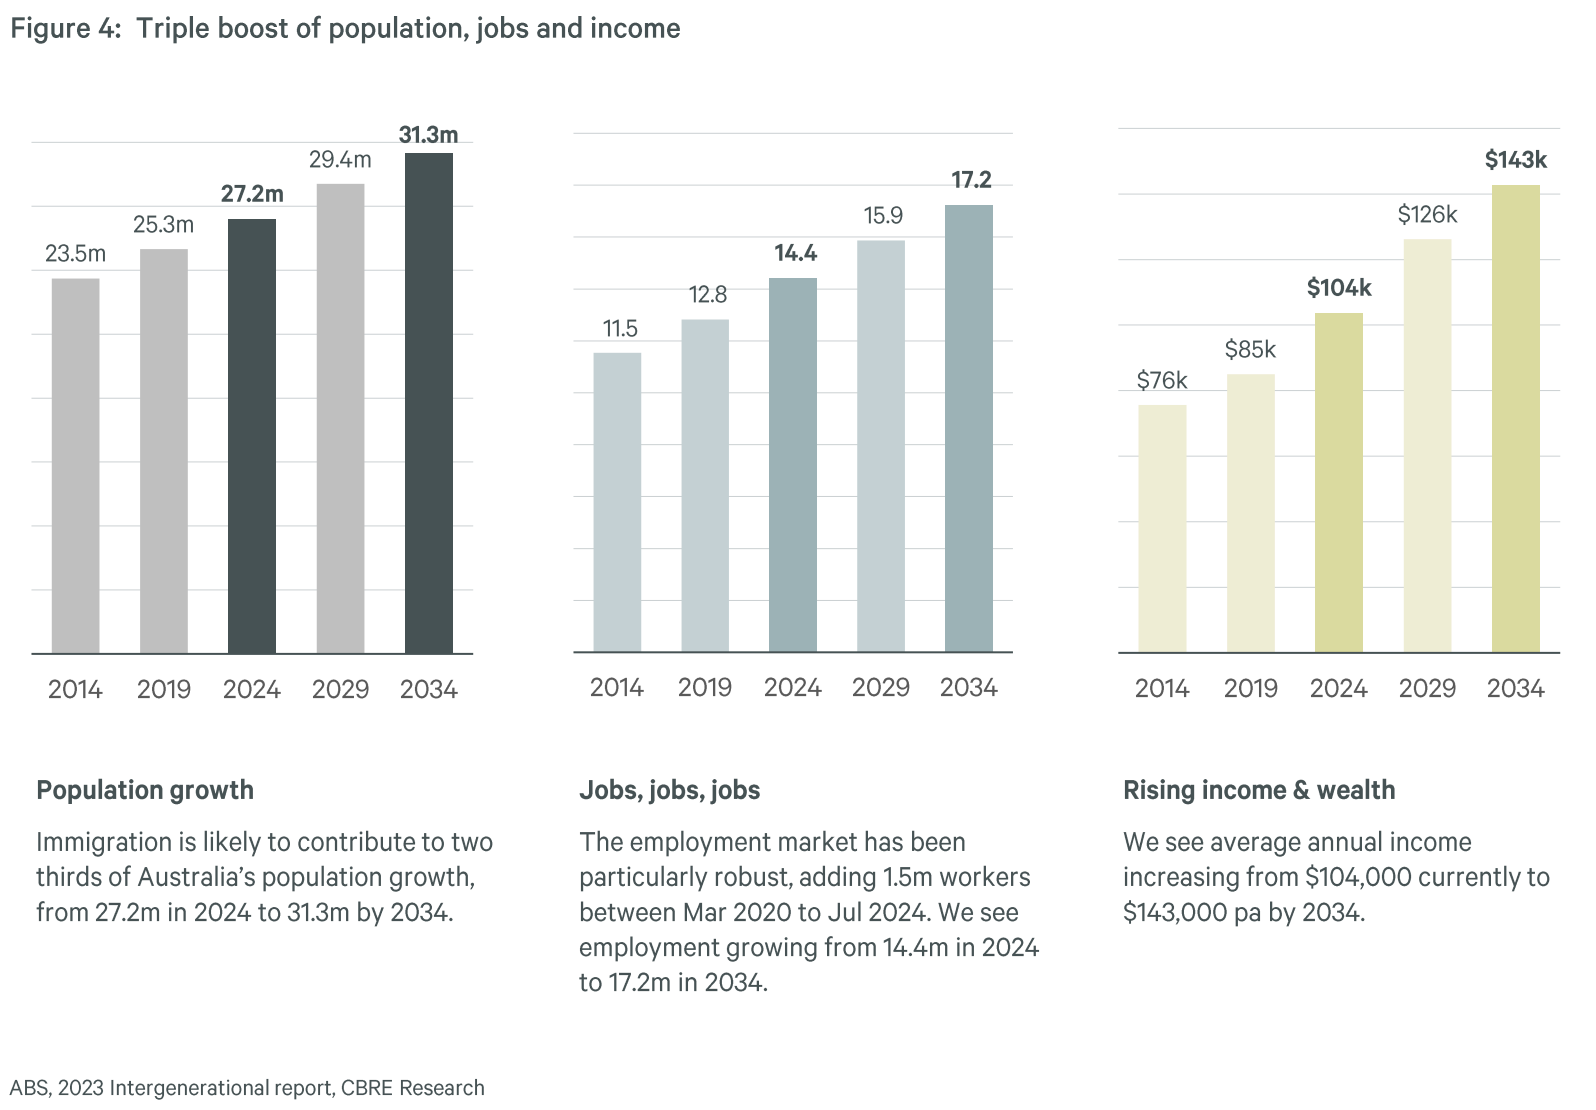
Over the next 10 years, demand for housing is expected to benefit from a triple boost: rising population (+4.1 million), rising jobs (+2.8 million), and rising income (+$39k).
CBRE estimates around $960 billion of additional income in the system to support mortgage, rent, and other living expenses.
You can always beat the averages.
While it’s likely that Brisbane property price growth will moderate from the strong growth over the last few years, the good news is that you can always beat the averages by investing in the right property in the right location.
Now, by that, I don’t mean look for the next hotspot. I mean buying quality properties in locations that will outperform in the long term such as gentrifying suburbs.
You see...property offers countless opportunities to improve your results through your own time, skills and knowledge – so you don’t need to settle for average.
And there’s more to it than just location. You can add value through refurbishment or redevelopment.
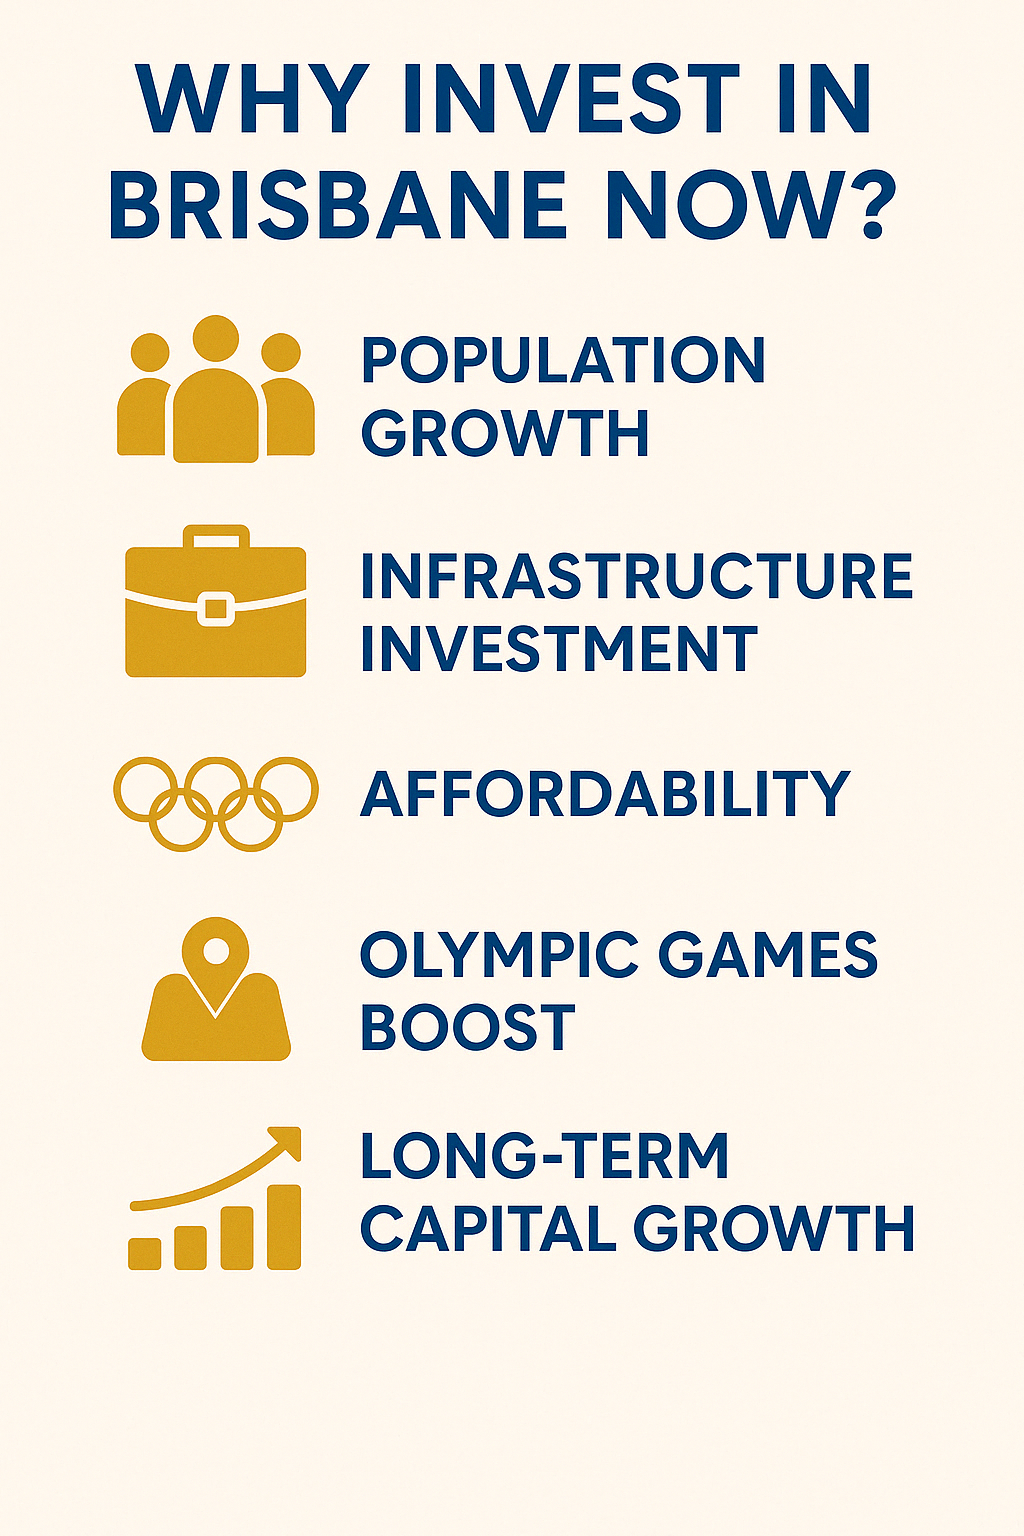
Why Brisbane is Set to Keep Growing
Despite rising prices making property less affordable, the Brisbane property market is expected to keep steaming ahead in 2026 and it is likely the Brisbane will once again be one of the strongest performing housing markets in 2026.
At Metropole Brisbane we’re finding that strategic investors and homebuyers are actively back looking to upgrade, picking the eyes out of the market.
Despite having reached record-high prices, Brisbane remains one of the best places in Australia to invest — if you know where to look. The city’s fundamentals are exceptionally strong, supported by powerful tailwinds that will drive demand and capital growth for years to come.
Let’s explore the forces reshaping the Brisbane property market.
1. Population Growth is Surging
Queensland continues to attract the lion’s share of interstate migration, and Brisbane is absorbing much of that inflow. Lifestyle, affordability, and career opportunities are drawing thousands of Australians north each year.
This is not a short-term trend — it’s a structural shift that’s putting lasting pressure on housing demand.
According to ABS data, Queensland’s population grew by 2.3% in the year to June 2024 — well above the national average — and a large share of that growth landed in Greater Brisbane.
By 2032, when the Olympic flame is lit at the Gabba, Queensland’s population is expected to rise by over 16%, with the majority concentrated in and around Brisbane.
That means more people, more households, and more competition for limited housing.
2. Infrastructure Boom: Building a New Brisbane
Billions are being poured into transformative infrastructure projects that are reshaping how Brisbane lives and moves.
Projects like Cross River Rail, Brisbane Metro, and the Queen’s Wharf precinct are not just short-term construction jobs — they’re long-term city-shaping investments.
These projects are unlocking new corridors of accessibility, boosting employment, and fuelling confidence in the city’s growth.
As a result, suburbs once considered “too far” or “too hard to reach” are being re-rated, unlocking new opportunities for investors who move early.
3. The 2032 Olympics: A Decade of Opportunity
I've already explained my thoughts about this above.
4. Affordability Advantage
Compared to Sydney, Brisbane remains remarkably affordable — and that’s part of its appeal. The city’s median house price sits far below Sydney’s, yet its economy and population growth are catching up fast.
That means Brisbane offers strong value for investors seeking both yield and capital growth.
Buyers can enter quality suburbs with lower deposits and access higher rental returns, while still benefiting from rising demand.
For investors priced out of the southern capitals, Brisbane represents Australia’s best combination of affordability and upside potential.
The Bottom Line for Investors
Brisbane’s growth story is being fuelled by three converging forces: population, infrastructure, and affordability. Together, they’re creating the conditions for long-term, sustainable capital growth.
For investors, this isn’t about chasing hotspots or speculation — it’s about positioning strategically in the suburbs that will benefit most from Brisbane’s ongoing transformation.
At Metropole Brisbane, we’re already helping clients identify those opportunities — investment-grade locations where strong demographics, infrastructure upgrades, and limited supply combine to deliver reliable long-term returns.
This isn’t just about short-term stimulus. It’s reshaping Brisbane’s accessibility and appeal, unlocking previously undervalued suburbs and supporting long-term growth.
What about the rising interest rates?
Inflation just isn’t easing as quickly as many had hoped. Higher rents, insurance premiums, and energy costs are still feeding through the system.
And with the labour market remaining resilient, the RBA simply doesn’t have the breathing room it wants.
That’s why it lifted interest rates this year and may do so again.
What’s interesting is how quickly expectations have shifted. Only a few months ago, the conversation was all about further rate cuts. Now, the reality is that interest rates may stay higher for longer, and that does have consequences for the housing market.
But let’s be clear....I’m not talking about a sharp correction.
Severe supply constraints continue to underpin property prices.
However, higher borrowing costs do slow activity and change buyer behaviour, but a rate environment that slows Sydney and Melbourne more sharply will have a softer impact on Brisbane, where structural undersupply is doing more of the heavy lifting.
And here’s the key point most commentators miss...
Look back to the middle of last year, when interest rates were around these levels. Property markets performed remarkably well.
Because fundamentals still matter more than sentiment.
We have strong population growth, high employment, and a chronic shortage of new housing construction.
Add to that first home buyer schemes that are allowing tens of thousands of buyers to enter the market with just a 5% deposit, and you can see why demand hasn’t collapsed.

Note: The latest cash rate hikes are likely to act as a speed bump rather than a full-blown brake on house prices, with some pockets barely tapping the brakes at all.
Now, let’s talk numbers.
The average new mortgage is close to $700,000. A full pass-through of each 0.25% rate rise adds roughly $110 a month to repayments on a typical 30-year loan.
At the same time, borrowing capacity does take a hit. A median-income household will lose around $18,000 from their maximum borrowing power.
And that has flow-on effects. It pushes more buyers away from mid-tier homes and towards lower-priced properties – apartments, townhouses and houses further from city centres.
Meanwhile, construction costs, labour shortages, and developer feasibility issues are still choking off new supply. And interest rates don’t fix that problem.
With listings well below long-term averages, and supply-demand pressures firmly in place, a single rate hike is unlikely to materially change the overall market balance.
What it does create is uncertainty. And uncertainty temporarily sidelines some buyers.
That’s why I see this period as a genuine opportunity for those who are prepared.
If you’re finance-ready, fewer competitors can mean better negotiations, better selection, and better long-term outcomes.

Tip: As Warren Buffett famously said: be fearful when others are greedy, and greedy when others are fearful.
The best performing investment properties in Brisbane for 2026 and 2027
Brisbane’s property market is full of opportunity — but also full of traps for the unwary.
While some properties will deliver strong, sustainable growth, others will underperform or even go backwards. The difference, as always, comes down to buying the right property in the right location at the right time.
In 2026, investors should focus on three key segments of Brisbane’s market that are set to outperform:
-
Houses in lifestyle and growth suburbs
-
Townhouses in inner and middle-ring locations
-
Boutique apartments in high-demand lifestyle hubs
Let’s explore why these property types are likely to lead the next phase of Brisbane’s growth cycle.
1. Houses in Lifestyle and Growth Suburbs
Detached family homes in Brisbane’s established, high-demand suburbs will remain the standout performers.
As more families and professionals migrate north from Sydney and Melbourne seeking space, affordability, and lifestyle, houses in Brisbane’s inner and middle-ring suburbs will continue to attract intense demand — both from owner-occupiers and investors.
These homes offer the ideal mix of capital growth potential and strong rental yields.
What to look for:
-
3-4 bedroom homes on good-sized land parcels
-
Proximity to quality schools, green spaces, shops, and transport
-
Properties with renovation or redevelopment potential
-
Areas benefiting from infrastructure upgrades or gentrification
Suburbs to watch:
-
Inner-City: Paddington, Ashgrove, Red Hill – Character homes, close to the CBD, strong café culture, and scarce land make these perennial performers.
-
Western Suburbs: Indooroopilly, Chapel Hill, Kenmore – Excellent schools, leafy streets, and family appeal continue to drive strong demand.
-
Emerging Middle-Ring: Stafford, Kedron, Wavell Heights, Cannon Hill, Camp Hill, Mansfield – Gentrifying pockets close to employment hubs and major roads, offering affordable entry points with big growth potential.
Investor insight:
Focus on quality family homes in liveable, community-driven suburbs. These properties hold their value even during downturns and benefit from “emotional demand” — owner-occupiers willing to pay a premium for lifestyle and location.
2. Townhouses in Inner and Middle-Ring Suburbs
Townhouses have become the “sweet spot” for Brisbane investors — offering space, privacy, and liveability without the price tag of a detached house.
With affordability constraints increasing and more people embracing medium-density living, modern townhouses in low-density developments are seeing rising demand from young families, professionals, and downsizers.
Why they’re appealing:
-
Provide more space and functionality than apartments
-
Offer better affordability than standalone houses
-
Lower maintenance costs compared to traditional homes
-
Highly rentable in walkable, amenity-rich suburbs
Suburbs to target:
-
South Brisbane and Greenslopes – Vibrant inner hubs undergoing transformation, attracting medical professionals and CBD workers.
-
Carina and Camp Hill – Middle-ring suburbs just 7–10 km from the CBD, popular with young families seeking affordable space.
-
Stafford and Kedron – Strong transport links, access to major shopping centres, and proximity to the airport make these emerging townhouse hotspots.
What to buy:
3-bedroom townhouses with courtyards or private outdoor areas, in well-designed, low-rise complexes. Prioritise natural light, good layouts, and convenient access to transport, schools, and cafés.
3. Boutique Apartments in Lifestyle Hubs
While high-rise towers remain risky, boutique “family-friendly” apartments in lifestyle locations are quietly outperforming. These smaller complexes — typically 4 to 20 units — offer scarcity, character, and higher owner-occupier appeal.
They attract a steady mix of renters and buyers who want the convenience of apartment living without the crowding or oversupply issues of large developments.
What to buy:
2-bedroom, well-proportioned apartments with balconies, secure parking, and quality finishes in established, walkable neighbourhoods.
High-demand suburbs:
-
New Farm and Teneriffe – Riverside prestige, café culture, and high-end lifestyle appeal ensure ongoing demand from professionals and downsizers.
-
West End and Highgate Hill – Trendy, vibrant, and close to universities and hospitals, offering consistent rental appeal.
-
Albion and Wooloowin – Rapidly gentrifying northern suburbs with infrastructure upgrades and urban renewal creating strong long-term upside.
Investor insight:
Stick with established, boutique complexes in suburbs where people aspire to live — not just where developers are building. Quality and scarcity will always outperform quantity.
Key Takeaway for Investors
In 2026, Brisbane’s outperformers will share the same DNA:
-
Established suburbs with long-term owner-occupier appeal
-
Tight supply and low vacancy rates
-
High walkability and liveability
-
Access to schools, jobs, and transport
-
Potential to add value through renovation or redevelopment
For investors, that means avoiding the shiny “new” stock and focusing on proven, investment-grade properties with enduring demand.
At Metropole Brisbane, we’re helping our clients do exactly that — identifying those A-grade opportunities that align with the city’s evolving demographics and infrastructure growth, and building property portfolios designed for long-term performance.
Best Brisbane Suburbs to Watch in 2026
As Brisbane enters its next phase of growth, smart investors are focusing on suburbs with strong fundamentals — not speculative “hotspots.”
The best-performing areas will combine lifestyle appeal, limited supply, and long-term owner-occupier demand.
Here are some of the key suburbs we’re watching closely for 2026 and beyond — the ones positioned to outperform as Brisbane continues to evolve.
1. Paddington, Red Hill, and Ashgrove – Classic Inner-City Growth
These leafy, character-filled suburbs are Brisbane’s blue-chip heartland. Just minutes from the CBD, they offer timeless appeal, beautiful Queenslander homes, and an unbeatable lifestyle.
Why they’ll outperform:
-
Scarce land and strict heritage protections limit new supply
-
Strong demand from professionals and families seeking proximity to the city
-
Excellent cafés, schools, and amenities create enduring desirability
- Also read:This week’s Australian Property Market Update – Latest Data, State by State May 5th 2026

- Also read:Melbourne property market forecast for 2026 & 2027 | Why the opportunity is bigger than it looks

- Also read:Sydney property market forecast for 2026 and 2027 | Why the short-term softness is a long-term opportunity

- Also read:Latest Property Price Forecasts Revealed. Australian Property Market Outlook 2026: Where To Now After The Rate Rise.

- Also read:Brisbane Property Market Forecast [2026 & Beyond] – What The Olympics Decade Means for Investors.

- Also read:This week’s Australian Property Market Update – Latest Data, State by State May 5th 2026
Investor insight:
Well-located character homes here rarely come cheap, but they consistently outperform over time. Think long-term capital growth and high emotional demand.
2. Wilston, Windsor, and Lutwyche – Northern Corridor Transformation
Once overlooked, these suburbs are now seeing major renewal. With upgraded transport links, proximity to hospitals and schools, and a surge in quality townhouse and infill developments, the northern corridor is maturing fast.
Why they’ll outperform:
-
5–6 km from the CBD with improving infrastructure
-
Attractive to medical and education professionals
-
Urban renewal projects and new lifestyle amenities boosting livability
Investor insight:
Look for renovated post-war homes or modern townhouses in quiet, tree-lined streets close to train stations.
3. Camp Hill, Coorparoo, and Holland Park – The Family Belt
The inner south-east remains one of Brisbane’s most reliable performers. These established family suburbs offer space, great schools, and easy access to the CBD.
Why they’ll outperform:
-
Consistent owner-occupier demand from young families
-
Increasing gentrification and boutique café culture
-
Scarcity of quality housing stock keeps prices resilient
Investor insight:
Target modernised family homes or townhouses on low-maintenance blocks. Gentrification and school zones are key value drivers here.
4. Tarragindi, Salisbury, and Holland Park West – Emerging Growth Hubs
These suburbs are quietly becoming favourites among younger buyers priced out of the inner ring. They offer affordability, solid infrastructure, and quick access to the M1 and major employment hubs.
Why they’ll outperform:
-
Easy CBD access via upgraded motorways and public transport
-
Excellent local schools and green spaces
-
Renovation potential in undervalued pockets
Investor insight:
Seek homes on larger lots with potential to add value. With ongoing infrastructure improvements, these areas are on the cusp of significant re-rating.
5. Nundah, Wavell Heights, and Chermside West – The Northside All-Rounders
The northside’s popularity has surged thanks to major retail, transport, and lifestyle upgrades. Nundah’s village revival, coupled with nearby employment nodes, makes this corridor a standout.
Why they’ll outperform:
-
Strong local employment and shopping amenities (Chermside, Toombul)
-
Access to Brisbane Airport and the Gateway Motorway
-
Ongoing gentrification and new retail developments
Investor insight:
Focus on renovated or well-located properties within walking distance of cafés, parks, and transport. Townhouses here offer strong rental yields and owner-occupier appeal.
6. Taringa, Indooroopilly, and Toowong – The Western Education Precinct
These western suburbs combine lifestyle, prestige, and access to top-tier education — including the University of Queensland and Brisbane Boys’ College. They’re consistently sought-after by professionals, academics, and international families.
Why they’ll outperform:
-
Proximity to the CBD and leading schools
-
Large family homes and high-quality townhouses in tree-lined streets
-
Excellent transport via trains, buses, and the Western Freeway
Investor insight:
Focus on low-maintenance, high-appeal properties — particularly those with school catchment advantages or renovation potential.
7. Albion and Wooloowin – Quiet Achievers in the Inner North
Urban renewal and infrastructure upgrades are transforming these once-industrial suburbs into vibrant lifestyle hubs. Proximity to major employment zones and the airport adds to their appeal.
Why they’ll outperform:
-
Strategic location between CBD, Airport, and Fortitude Valley
-
Gentrification and mixed-use redevelopment creating new demand
-
Limited land supply and rising buyer interest
Investor insight:
Look for boutique apartments or renovated workers’ cottages. These suburbs still represent relative value compared to neighbouring blue-chip areas.
8. South Brisbane and West End – Lifestyle and Liveability
These inner-south suburbs are Brisbane’s cultural and entertainment heart. With universities, hospitals, and riverside attractions, they attract strong rental demand from professionals and students alike.
Why they’ll outperform:
-
Strong long-term rental demand from professionals and international students
-
Riverside lifestyle and access to the CBD
-
Ongoing urban renewal and cultural investments
Investor insight:
Focus on boutique apartment complexes with high owner-occupier appeal and secure parking. Avoid high-density towers.
The Bottom Line
The best suburbs to watchshare one thing in common — they’re liveable, desirable, and supply-constrained.
They attract long-term residents, not speculative investors, and are supported by jobs, infrastructure, and lifestyle amenities.
For investors, the goal isn’t to chase the next “hotspot” — it’s to buy strategically in proven locations where demand will remain strong through every stage of the property cycle.
That’s where the team at Metropole Brisbane comes in — helping our clients identify investment-grade properties using our research-backed, data-driven approach so they can build safe, sustainable, and growing wealth.
Here are a few key areas with long-term growth potential:
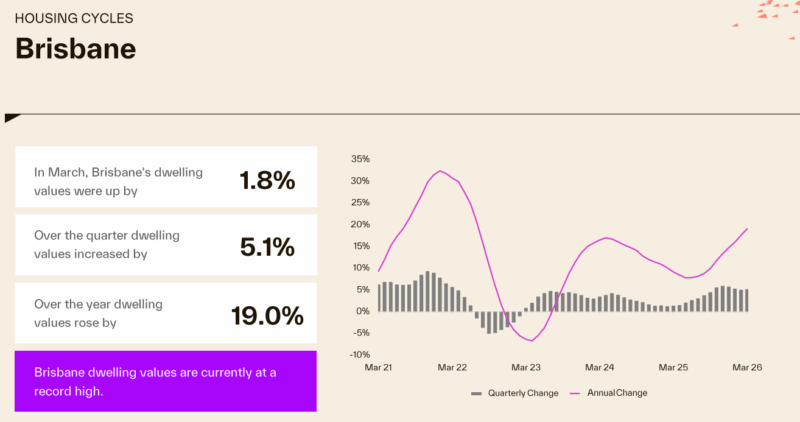
What's happening in the Brisbane property market?
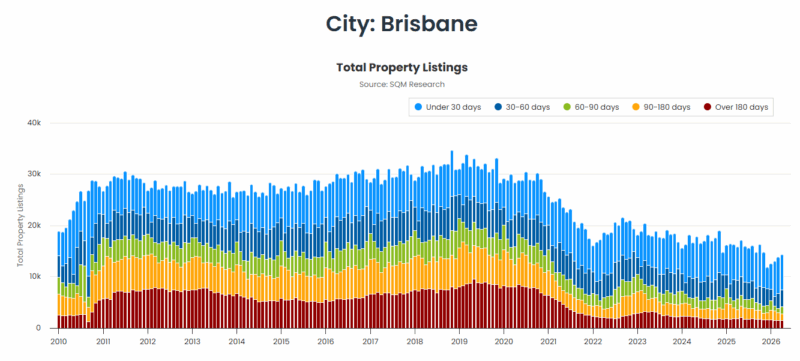
Source: SQM Research
Moving forward, Queensland has been tipped to have more million dollar suburbs than Victoria by the end of 2025, according to analysis by Ray White.
Of the six states and two territories, Queensland is the fastest growing with its count of $1 million suburbs growing by 25 times over the last decade from just seven to 174.
Second in terms of growth rate is ACT with an 11 times growth in count of $1 million suburbs from just six in 2014 to 70 in 2024.
Assuming the growth rate of the last decade maintains its trend for the next 12 months, we can expect around 99 new suburbs to pass the $1 million mark.
Thirty of these will come from New South Wales, 24 from Queensland, and 18 from Victoria, which means Queensland has a very high probability of overtaking Victoria as the state with the second most count of million dollar suburbs.
Brisbane’s rental markets remain exceptionally tight
Brisbane's rental markets remain tough for tenants with rising rents and continuing near record-low vacancy rates for both houses and units.:
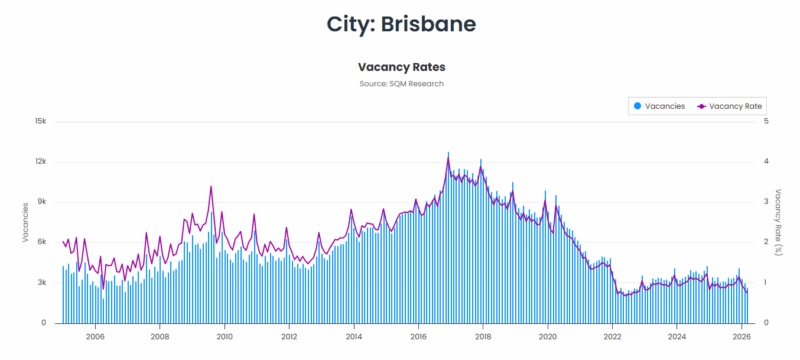
Source: SQM Research
Like everywhere else in the country, Brisbane’s rental market is in crisis.
The city has seen significant investment in recent years, and many people have moved to Brisbane to take advantage of job opportunities and high quality of life.
But a migration surge has led to an increased demand for rental properties, which has kept the vacancy rate low.
While the current vacancy rate in Brisbane may be good news for landlords, it only serves to exacerbate the city’s already pressurised rental market with renters increasingly struggling to look for affordable housing.
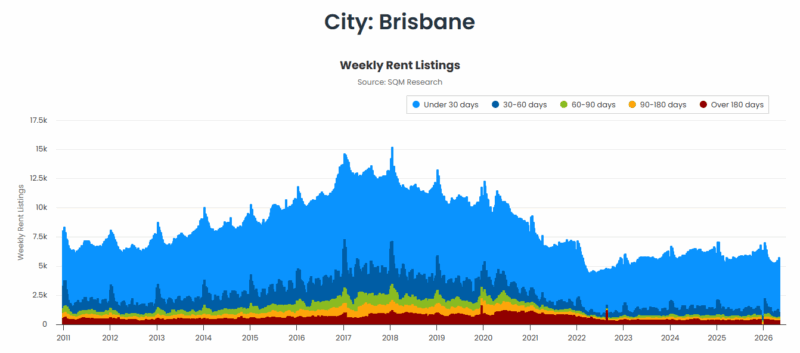
Source: SQM Research
2026 is unlikely to provide any relief for tenants with new home building levels remaining chronically recessed despite government policies designed to reduce surging migration.
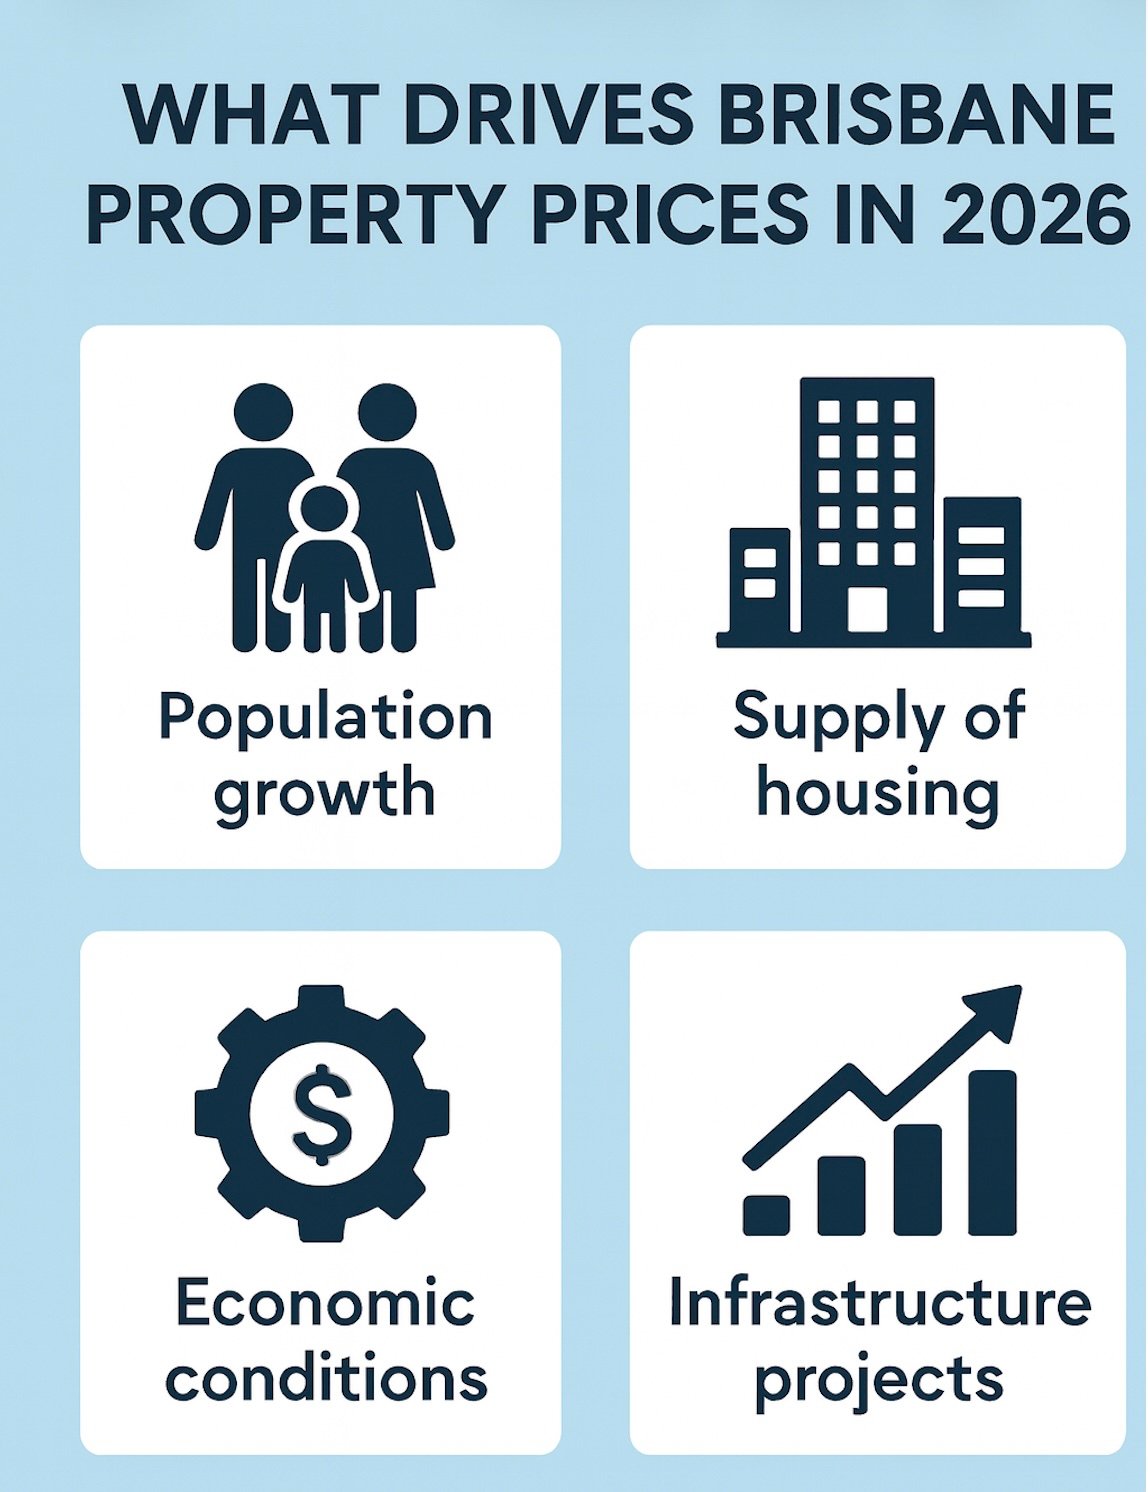
Key Trends Shaping Brisbane’s Property Market in 2026 and Beyond
Brisbane’s property market isn’t just experiencing a brief post-COVID boom — it’s undergoing a long-term transformation driven by powerful demographic, economic, and social shifts. Let’s look at the key trends shaping its future and what they mean for investors.
1. Population Growth at Record Levels
Brisbane’s population is expanding faster than almost any other capital city in Australia.
According to the latest ABS data, Queensland grew by around 2.3% in 2023–24, outpacing the national average — and Greater Brisbane absorbed most of that growth.
This surge is being driven by:
-
Interstate migration – Australians moving north for affordability, space, and lifestyle.
-
Overseas migration – skilled workers and students choosing Brisbane for its education, safety, and livability.
-
Natural increase – younger demographics forming new households faster than Sydney or Melbourne.
Every one of these new residents needs a place to live — and with limited new construction, that’s putting constant upward pressure on prices and rents.
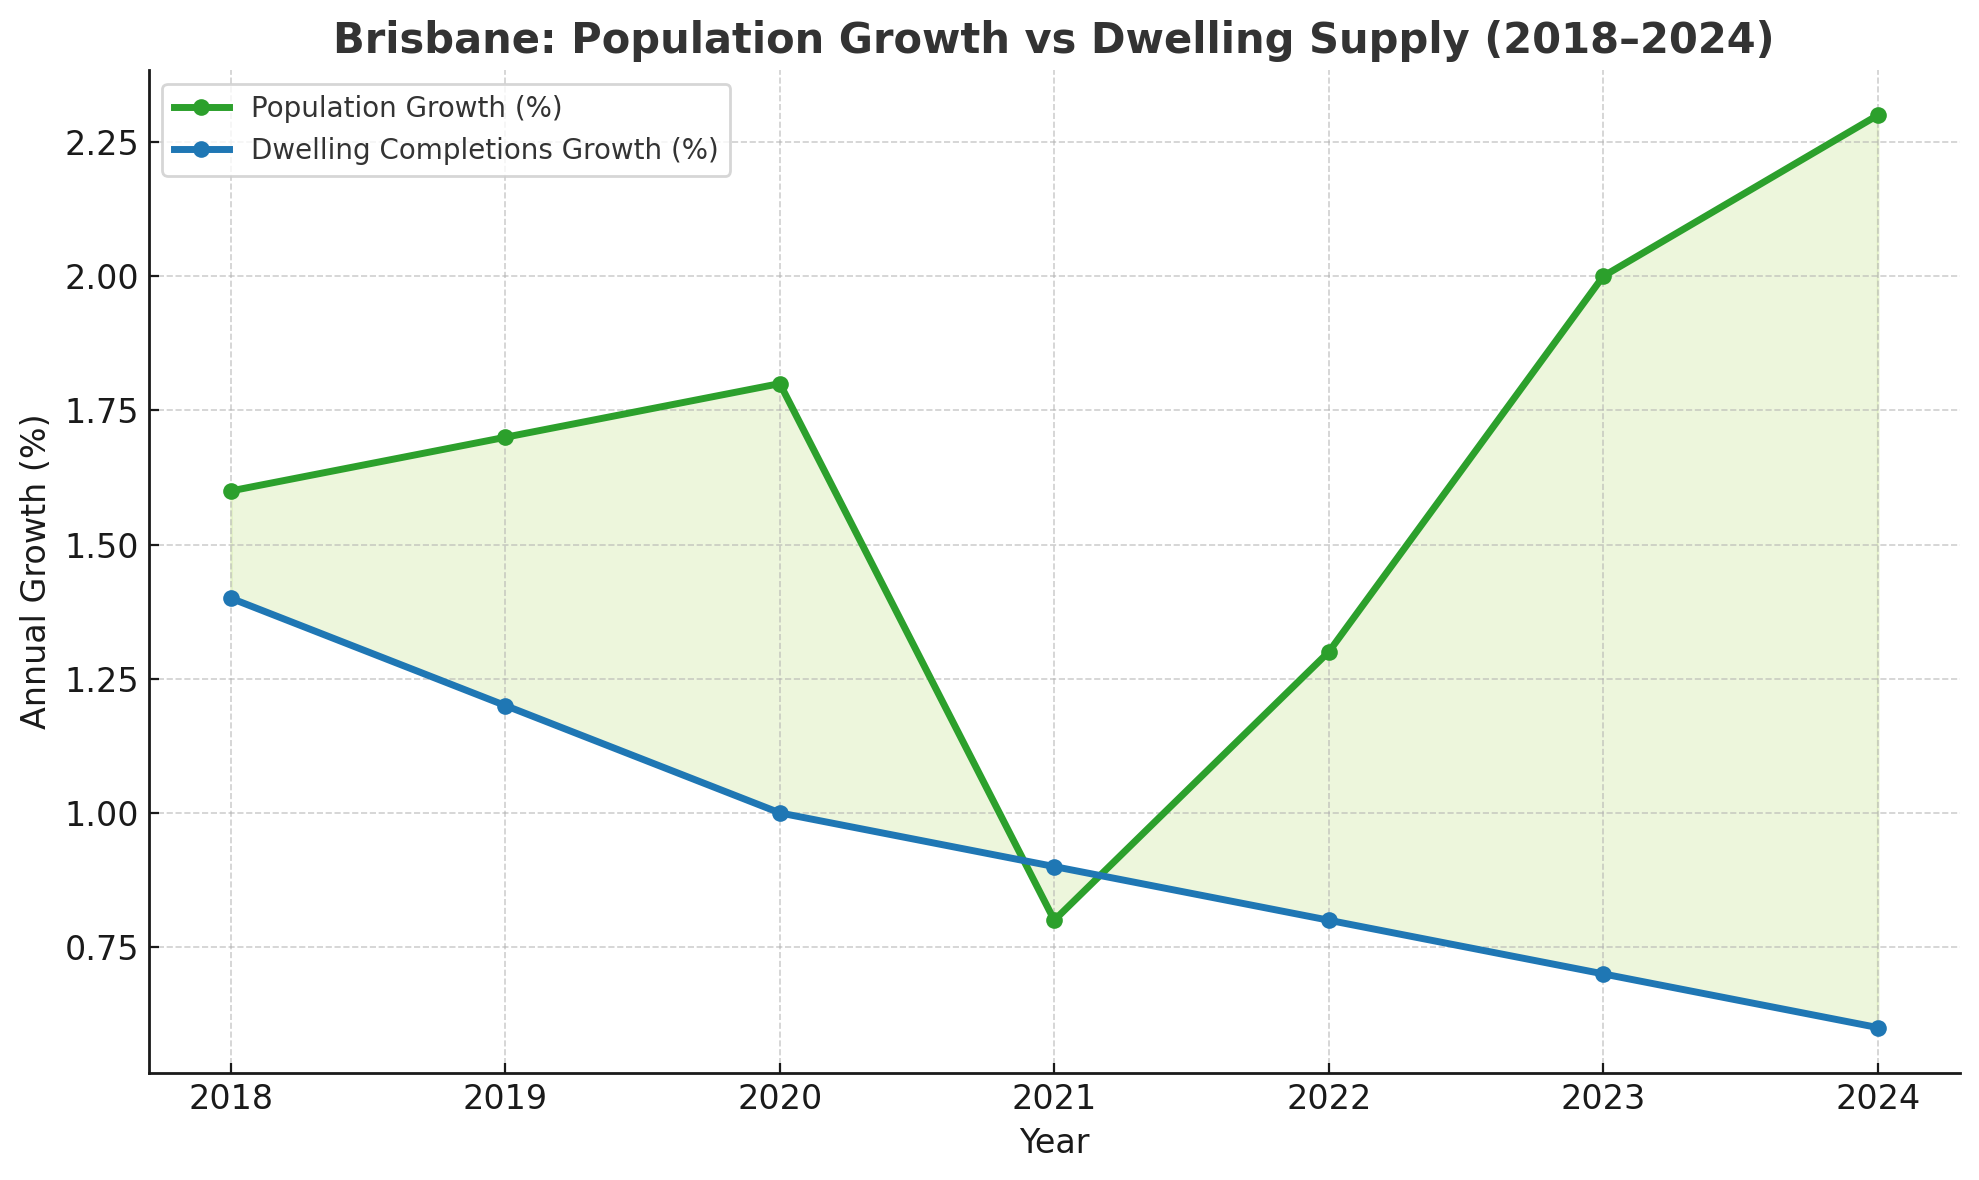
2. Tight Supply and Construction Bottlenecks
The other side of the equation is supply, and Brisbane simply doesn’t have enough of it.
Building approvals remain well below demand, with rising construction costs and builder insolvencies further slowing the pipeline.
Despite population growth, the number of new dwellings completed in last year fell to its lowest level in almost a decade. Many projects have stalled or been cancelled entirely due to rising costs and labour shortages.
That means we’re entering a multi-year period of chronic undersupply — where new housing can’t keep pace with new households. For investors, that’s a classic setup for rising rents and capital growth.
3. Affordability Advantage Still Driving Demand
Compared to Sydney, Brisbane remains highly affordable — and that’s one of its strongest competitive edges.
Even after recent price growth, Brisbane’s median house price is still hundreds of thousands of dollars below Sydney’s, while offering better rental yields and a more balanced economy.
This affordability is attracting both:
-
Owner-occupiers upgrading from interstate, and
-
Investors seeking higher returns without sacrificing capital growth potential.
As interest rates begin to ease, Brisbane’s value gap with Sydney and Melbourne is likely to narrow — meaning there’s still plenty of upside for early movers.
4. The Infrastructure Decade
Infrastructure is the backbone of Brisbane’s growth story. Billions of dollars are being invested in transformative projects that will reshape how the city functions and connects.
Major projects include:
-
Cross River Rail – delivering faster, high-capacity rail across the city.
-
Brisbane Metro – improving public transport and cutting congestion.
-
Queen’s Wharf – adding a world-class entertainment and tourism precinct.
-
Brisbane Airport expansion – supporting tourism, logistics, and jobs.
-
Olympics 2032 precincts – accelerating urban renewal across South East Queensland.
These projects don’t just create jobs — they permanently elevate accessibility, desirability, and amenity, unlocking new investment corridors and increasing property values across surrounding suburbs.
5. The Olympic Effect
Hosting the 2032 Olympic Games is already reshaping Brisbane’s future.
Unlike Sydney 2000, which focused primarily on the Games themselves, Brisbane’s Olympic planning is being integrated into long-term city-building strategies.
The lead-up to 2032 will drive new housing, transport, and community infrastructure. It will put Brisbane on the global stage, attracting business investment, tourism, and international residents — all of which feed directly into the housing market.
The Games won’t just be a two-week event; they’ll be a 10-year economic catalyst.
6. Lifestyle, Liveability, and Climate Migration
Brisbane’s lifestyle advantage continues to attract new residents. The city offers a relaxed climate, coastal proximity, growing job hubs, and an increasingly cosmopolitan culture.
Many Australians are now prioritising lifestyle, flexibility, and space — and Brisbane delivers all three. With hybrid work here to stay, more professionals can live in Brisbane and still work for companies based in Sydney or Melbourne.
This long-term “lifestyle migration” is expanding Brisbane’s professional class and driving up demand for well-located family homes and townhouses in lifestyle suburbs.
7. Rising Rents and Investor Opportunity
Brisbane’s rental market remains one of the tightest in the nation. Vacancy rates have hovered near 1%, while rents have surged over 35% since 2020 — and further increases are likely as supply struggles to catch up.
For investors, that means higher yields and strong competition among tenants. For renters, it means ongoing upward pressure on prices — especially in family-friendly, well-located suburbs.
The imbalance between new housing supply and population growth will ensure continued rental strength and a firm floor under property values.
The Takeaway for Investors
Brisbane’s outlook is underpinned by a rare combination of factors — strong population growth, chronic undersupply, major infrastructure investment, relative affordability, and the Olympics tailwind.
Together, these forces are setting the stage for sustained price growth and rental demand over the coming decade.
But to benefit, investors must be strategic. Not every property will rise with the tide — only those in tightly held, owner-occupier–appeal suburbs will consistently outperform.
That’s where a Metropole Strategic Property Plan can help you identify the right suburbs, property types, and timing — so you can invest safely, confidently, and profitably in Brisbane’s next growth phase.
Brisbane’s migration and population growth vs. property prices
Brisbane and Queensland can thank a huge influx of internal migrants for the robustness of their property markets over the last few years – between the pandemic, lockdowns, and a surging property market many Australians, particularly from Victoria and NSW, flocked northwards to our Sunshine State in search of more affordable property in lifestyle suburbs.
And this lifestyle move still holds true today.

Source: ABS data
Popular areas of the Gold Coast and Sunshine Coast have enjoyed strong demand considering the increased flexibility of being able to work from home and commuting to the big smoke less frequently.
At the same time property investor activity has been strong, particularly for houses, not only coming from locals but from interstate investors who see a strong upside in Brisbane property prices as well as favourable rental returns.
Of course, there is not one Queensland property market, nor one south-east Queensland property market, and different locations are performing differently and are likely to continue to do so.
Queensland recorded a population growth rate of 2.3% in the 12 months to 30 June 2024, above the national average (2.1%).
And there is more forecasted population growth on the horizon.
Federal government forecasts suggest that Queensland’s population is expected to grow by more than 16% by the time Brisbane hosts the Olympic Games in 2032.
And the population spread in Australia’s most decentralised state is tipped to sway towards the city, with most Queenslanders expected to live in Greater Brisbane by the time the Olympic flame is lit at the Gabba.
Greater Brisbane is expected to grow faster than the rest of Queensland, with a rate of 1.9% projected for the capital in 2022-23, compared to 1.4% for the rest of the state.
That means that Queensland’s population is set to boom in the coming decades, from the current 5.4 million people to as much as 8.27 million by 2046.
Brisbane’s fundamentals are very strong
It’s not just Brisbane’s population and migration growth that is holding up the state’s economy, the remainder of the city’s underlying fundamentals are also very strong.
CommSec's State of the States report assesses economic performance across Australia and shows that on an aggregate basis our resources-focused states Queensland and Western Australia both have the strongest annual economic momentum, supported by robust housing markets and solid population growth.
Queensland recently took first spot with Western Australia slipping to second.
There is little to separate the commodities and tourism-heavy states, with Queensland ranked first or second on five of the eight key economic indicators.

While Brisbane’s property market was significantly more affordable before the recent property boom, it still represents a valuable benefit to buyers who are looking to purchase at a time when interest rates are falling and we move into the next phase of the property cycle.
And the impending 2032 Olympics, hosted by Brisbane, will only serve to put even more pressure on the city.
The need for upgraded infrastructure and transport in Brisbane, the Gold Coast, and the Sunshine Coast will likely put a rocket under Brisbane’s property market.
Why?
Because infrastructure spending is one of the most powerful forces in residential real estate – it can transform local economies and generate real estate booms.
That’s because major infrastructure projects can elevate the appeal of locations by improving the accessibility or amenity of an area and they can also generate economic activity and jobs during construction.

Final Thoughts
The Brisbane property market continues to offer compelling investment opportunities—but only for those who take a strategic, research-backed approach.
With strong population growth, infrastructure investment, rising rental demand, and the Olympics ahead, Brisbane has all the ingredients for sustained capital growth and wealth creation.
But success won’t come from following the herd or buying in hype-driven locations.
It will come from careful selection, long-term vision, and expert advice.
How Metropole Can Help You Invest with Confidence
At Metropole, we’ve spent the past 30 years helping Australians safely grow, protect, and pass on their wealth. We don’t sell properties — we provide independent, strategic advice tailored to your personal goals, financial position, and risk profile.
Through our Strategic Property Plan, we’ll help you:
-
Clarify your long-term wealth and lifestyle goals.
-
Develop a step-by-step property investment strategy to achieve them.
-
Identify the right type of property to suit your budget and timeline.
-
Build a resilient portfolio designed to weather any market conditions.
And because we have boots on the ground here in Brisbane, we know which suburbs are quietly outperforming, which are nearing their peak, and which are poised for transformation.
Whether you’re a first-time investor looking to start safely or a sophisticated investor expanding your portfolio, our award-winning team will help you take the next step with clarity and confidence.
Don’t leave your financial future to chance.
If you’re serious about building long-term wealth through property — the kind that lets you live life on your terms — now is the time to act.
👉 Click here NOW and book your complimentary Wealth Discovery Chat with one of our property strategists today.We’ll review your situation, answer your questions, and show you how to make Brisbane’s next growth phase work for you — safely and strategically.
Because the right advice today could be the difference between “getting by” and getting ahead in the decade ahead.


