


Key takeaways
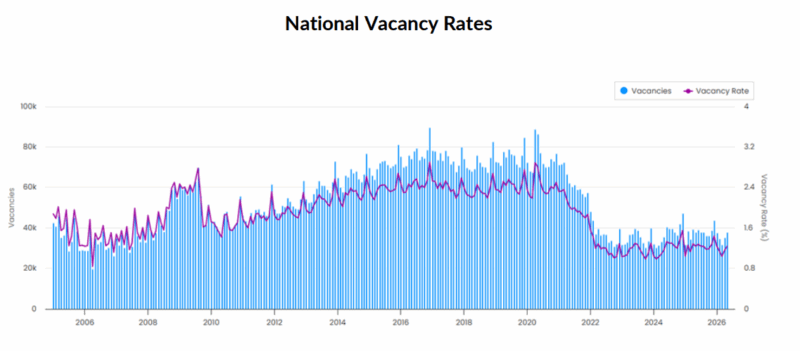
Australia’s national residential vacancy rate remained unchanged at 1.2% in May 2026, with total residential vacancies increasing from 35,258 to 37,844 dwellings over the month.
While vacancy rates rose in several capital cities, conditions remain tight overall, with all capital cities continuing to record vacancy rates below 2%.
SQM Research released its latest data on residential rental property vacancy rates.
Australia’s national residential vacancy rate remained unchanged at 1.2% in May 2026, with total residential vacancies increasing from 35,258 to 37,844 dwellings over the month.
While vacancy rates rose in several capital cities, conditions remain tight overall, with all capital cities continuing to record vacancy rates below 2%.
Vacancy Rates - May 2026
| City | May 2025 Vacancies | May 2025 Vacancy Rate | Apr 2026 Vacancies | Apr 2026 Vacancy Rate | May 2026 Vacancies | May 2026 Vacancy Rate |
|---|---|---|---|---|---|---|
| Sydney | 10,808 | 1.5% | 9,696 | 1.3% | 10,820 | 1.5% |
| Melbourne | 9,074 | 1.7% | 8,079 | 1.5% | 8,446 | 1.6% |
| Brisbane | 3,064 | 0.9% | 2,900 | 0.8% | 3,124 | 0.9% |
| Perth | 1,416 | 0.7% | 1,138 | 0.6% | 1,265 | 0.7% |
| Adelaide | 1,240 | 0.8% | 1,117 | 0.7% | 1,081 | 0.7% |
| Canberra | 891 | 1.5% | 873 | 1.4% | 970 | 1.6% |
| Darwin | 129 | 0.5% | 75 | 0.3% | 75 | 0.3% |
| Hobart | 177 | 0.6% | 140 | 0.5% | 161 | 0.6% |
| National | 37,879 | 1.2% | 35,258 | 1.2% | 37,844 | 1.2% |
Source: SQM Research
Capital city highlights
Sydney:
Vacancy rates increased to 1.5%, up from 1.3% in April, with 10,820 dwellings available.
Vacancies remain broadly in line with the same time last year, with the monthly increase reflecting the usual seasonal rise in vacancies as the market moves into the cooler months.
Melbourne:
Vacancy rates rose to 1.6%, from 1.5%, with 8,446 vacancies recorded.
Melbourne remains the most balanced of the major capital rental markets, though vacancies are marginally tighter than the same time last year.
Brisbane:
Vacancy rates increased to 0.9%, from 0.8%, with 3,124 dwellings available.
Despite the rise, Brisbane remains one of the tightest rental markets among the major capitals.
Perth:
Vacancy rates edged up to 0.7%, from 0.6%, with 1,265 dwellings available.
Perth continues to experience tight rental conditions despite a gradual increase in available stock.
Adelaide:
Vacancy rates remained unchanged at 0.7%, with 1,081 dwellings available.
Supply remains constrained relative to demand.
Canberra:
Vacancy rates rose to 1.6%, from 1.4%, with 970 vacancies recorded.
The increase reflects a modest easing in rental market conditions.
Darwin:
Vacancy rates remained unchanged at 0.3%, with just 75 dwellings available.
Darwin continues to record the lowest vacancy rate in the country.
Hobart:
Vacancy rates increased to 0.6%, from 0.5%, with 161 dwellings available.
Despite the increase, rental supply remains extremely limited.
Seasonality in focus
Australia’s rental market follows a consistent seasonal rhythm. Nationally, vacancies are typically highest in December, when year-end turnover lifts listings, and tightest in February and March, as strong start-of-year demand absorbs available stock.
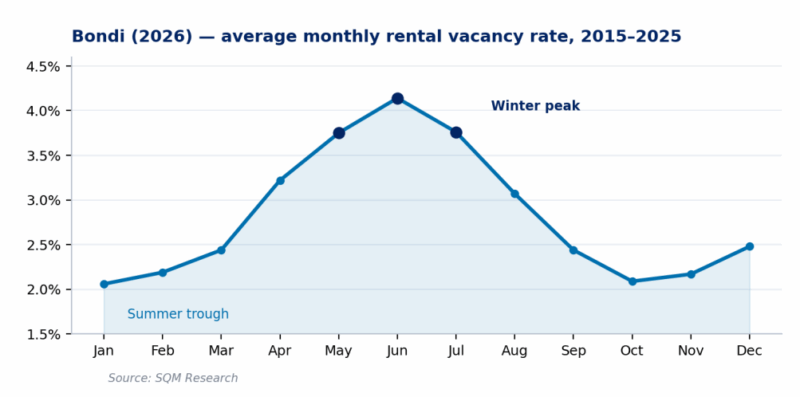
The effect is far larger in some markets than others. Beachside and holiday locations show the strongest swings: in Bondi (postcode 2026), the long-term vacancy rate troughs near 2% across spring and summer — when holiday-letting demand peaks and owners favour short-stay letting — then climbs to around 4% by June as that stock returns to the long-term pool for winter.
Averaged over the past decade, winter vacancies in Bondi run roughly 60% higher than over summer, and the same pattern is visible across the Gold Coast.
The reverse holds in the tropical north: in Darwin, vacancies fall to their lowest over the dry-season winter, when demand peaks, and rise through the wet-season summer.
Much of the month-to-month movement in headline vacancy rates reflects this seasonal rotation of stock rather than any genuine change in housing supply.
Advertised rents analysis
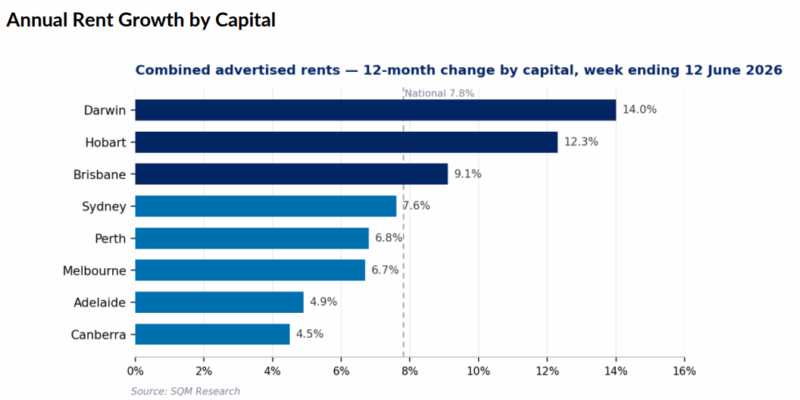
National advertised rents continued to rise through June, with combined rents increasing 0.4% over the past 30 days and 7.8% higher year-on-year, highlighting ongoing pressure in Australia’s rental market.
The national combined rent average now stands at $700.04 per week, while the capital city average has increased to $797.37 per week, supported by ongoing growth across most capital cities.
Nationally, house rents rose 0.5% for the month and 8.2% over the year, while unit rents increased 0.3% monthly and 7.3% annually, reflecting sustained demand for both detached housing and medium-density accommodation.
Sydney:
Combined rents eased 0.1% for the month but remain 7.6% higher year-on-year, with house rents averaging $1,154.51 per week.
Melbourne:
Combined rents increased 0.8% monthly and 6.7% annually, supported by continued strength in both houses and units.
Brisbane:
Combined rents rose 0.8% for the month and 9.1% over the year, maintaining one of the strongest annual growth rates among the major capitals.
Perth:
Combined rents increased 1.0% over the month and 6.8% annually, reflecting ongoing rental shortages despite a modest rise in vacancies.
Adelaide:
Combined rents rose 0.1% for the month and 4.9% year-on-year, with unit rents continuing to outperform houses.
Canberra:
Combined rents increased 0.1% monthly and 4.5% annually, indicating stable rental market conditions.
Darwin:
Combined rents surged 5.1% for the month and 14.0% annually, recording the strongest monthly rental growth nationally.
Hobart:
Combined rents were broadly unchanged over the month (-0.1%) but remain 12.3% higher year-on-year, reflecting ongoing supply constraints.
Weekly rents index
Sydney
| Property Type | Rent ($) | Weekly change | Monthly change | 12 Months change |
|---|---|---|---|---|
| All Houses | $1,154.51 | 0.48 | -0.5% | 7.5% |
| All Units | $759.24 | -1.24 | 0.3% | 7.6% |
| Combined | $919.65 | -0.54 | -0.1% | 7.6% |
Source: SQM Research
Melbourne
| Property Type | Rent ($) | Weekly change | Monthly change | 12 Months change |
|---|---|---|---|---|
| All Houses | $823.20 | -1.20 | 1.4% | 8.3% |
| All Units | $600.76 | 1.25 | 0.3% | 4.9% |
| Combined | $694.24 | 0.22 | 0.8% | 6.7% |
Source: SQM Research
Brisbane
| Property Type | Rent ($) | Weekly change | Monthly change | 12 Months change |
|---|---|---|---|---|
| All Houses | $832.36 | 0.65 | 1.2% | 10.5% |
| All Units | $640.87 | -0.87 | 0.2% | 6.9% |
| Combined | $746.07 | -0.04 | 0.8% | 9.1% |
Source: SQM Research
Perth
| Property Type | Rent ($) | Weekly change | Monthly change | 12 Months change |
|---|---|---|---|---|
| All Houses | $901.26 | 2.74 | 1.8% | 8.5% |
| All Units | $677.83 | 0.17 | -0.5% | 3.5% |
| Combined | $809.16 | 1.68 | 1.0% | 6.8% |
Source: SQM Research
Adelaide
| Property Type | Rent $) | Weekly change | Monthly change | 12 Months change |
|---|---|---|---|---|
| All Houses | $685.01 | 3.99 | 0.3% | 4.3% |
| All Units | $557.73 | 1.26 | -0.2% | 6.2% |
| Combined | $642.19 | 3.08 | 0.1% | 4.9% |
Source: SQM Research
Canberra
| Property Type | Rent ($) | Weekly change | Monthly change | 12 Months change |
|---|---|---|---|---|
| All Houses | $839.25 | -3.25 | -0.2% | 6.9% |
| All Units | $596.54 | -1.55 | 0.5% | 2.0% |
| Combined | $705.54 | -2.31 | 0.1% | 4.5% |
Source: SQM Research
Darwin
| Property Type | Rent ($) | Weekly change | Monthly change | 12 Months change |
|---|---|---|---|---|
| All Houses | $843.48 | -0.48 | 3.5% | 12.4% |
| All Units | $637.23 | 2.77 | 6.6% | 15.3% |
| Combined | $721.78 | 1.44 | 5.1% | 14.0% |
Source: SQM Research
Hobart
| Property Type | Rent 9$) | Weekly change | Monthly change | 12 Months change |
|---|---|---|---|---|
| All Houses | $626.37 | 3.63 | -1.2% | 8.3% |
| All Units | $591.50 | 14.51 | 1.8% | 19.3% |
| Combined | $612.49 | 7.96 | -0.1% | 12.3% |
Source: SQM Research
National
| Property Type | Rent ($) | Weekly change | Monthly change | 12 Months change |
|---|---|---|---|---|
| All Houses | $781.00 | 7.00 | 0.5% | 8.2% |
| All Units | $606.00 | 2.00 | 0.3% | 7.3% |
| Combined | $700.04 | 4.69 | 0.4% | 7.8% |
Source: SQM Research
Cap City Average
| Property Type | Rent ($) | Weekly change | Monthly change | 12 Months change |
|---|---|---|---|---|
| All Houses | $929.00 | 0.00 | 0.3% | 8.0% |
| All Units | $681.00 | -2.00 | 0.0% | 6.2% |
| Combined | $797.37 | -1.07 | 0.2% | 7.2% |
Source: SQM Research
Commentary
The national vacancy rate held steady at 1.2% in May.
Where vacancies did rise across a number of cities, that largely reflects normal seasonal patterns — May and June are typically among the higher-vacancy months of the year, outside the December peak, as leasing slows over the cooler months.
On a year-on-year basis the market is unchanged, sitting at the same 1.2% as it did in May last year.
That said, vacancy rates remain exceptionally low by historical standards. Brisbane, Perth, Adelaide, Darwin, and Hobart are all still recording vacancy rates below one per cent, indicating that rental supply remains severely constrained.
At the same time, national asking rents are continuing to rise, up 7.8% over the past year. Strong rental growth in cities such as Darwin, Hobart and Brisbane demonstrates that demand is still outpacing available supply.
Sydney is marginally tighter than it was a year ago, and Melbourne, while the most balanced of the major capitals, has also tightened over the past twelve months.
Australia’s rental market remains fundamentally undersupplied.
Without a substantial increase in housing construction and rental stock, and/or a meaningful decrease in population growth rates from current levels, affordability pressures are likely to persist through the remainder of 2026 and into 2027.


