


Key takeaways
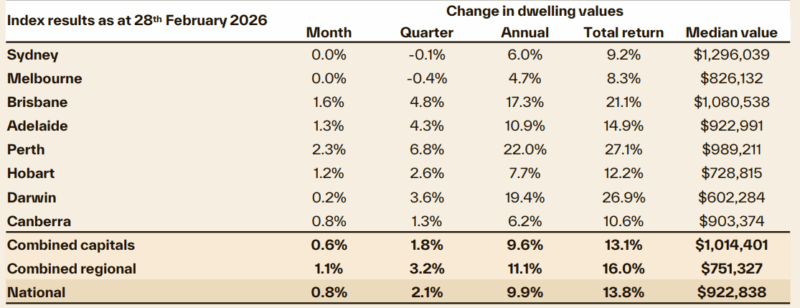
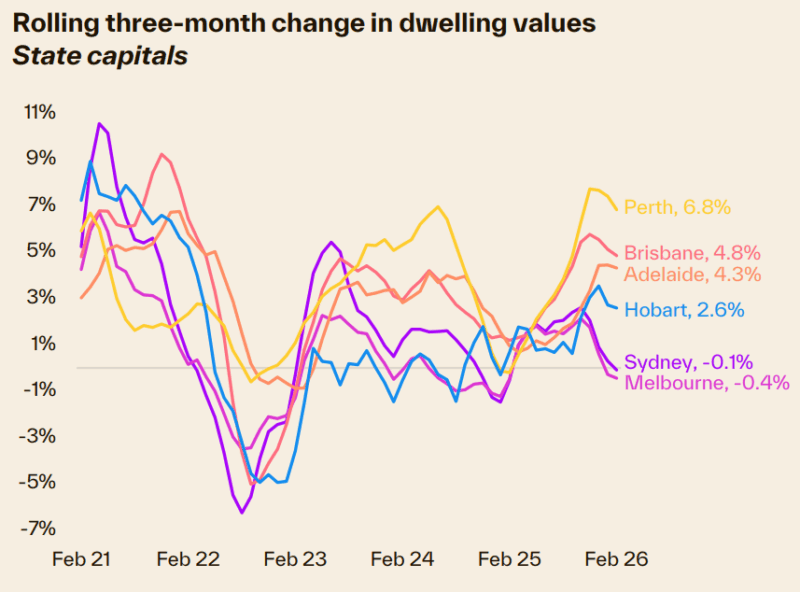
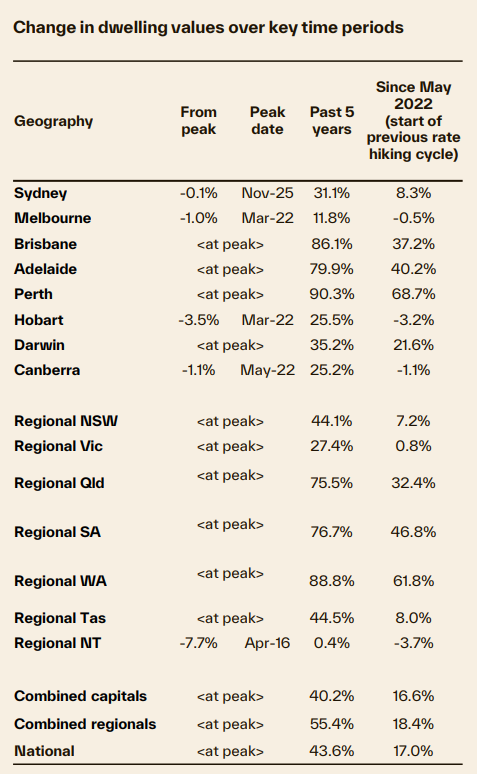
Australia’s housing market has split into two speeds: Perth is surging (+2.3% in February), with Brisbane, Adelaide and Hobart also posting solid gains, while Sydney and Melbourne have flatlined as higher rates and weaker sentiment bite.
Ultra-low listings are driving growth in the mid-sized capitals, especially Perth, where stock is nearly 50% below its five-year average—supporting price rises even as demand softens in the larger cities.
Affordability pressures are reshaping demand, with strength concentrated in lower-priced segments and regions, while higher-end markets and investor cash flow face growing constraints from serviceability limits and rising costs.
Two months into 2026, and we have seen a clear divergence in housing trends, with Sydney and Melbourne values flatlining while the mid-sized capitals continue to record a solid rate of gain at more than 1% month on month growth.
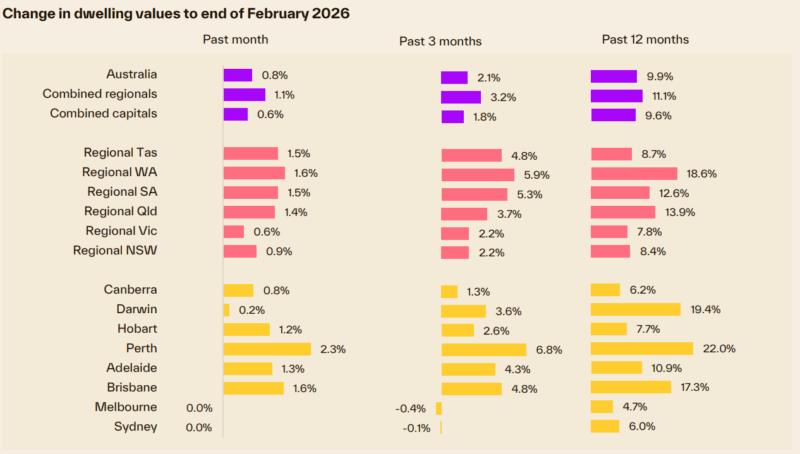
Perth is showing the strongest trend, with home values jumping 2.3% in February, adding more than $22,500 to the median dwelling value over the month.
Brisbane, Adelaide and Hobart have also recorded a rise of more than 1% in February.
Sydney and Melbourne have been less resilient to the February rate hike and the drop in sentiment, with home values flat over the month and down -0.1% and -0.4% over the rolling quarter.
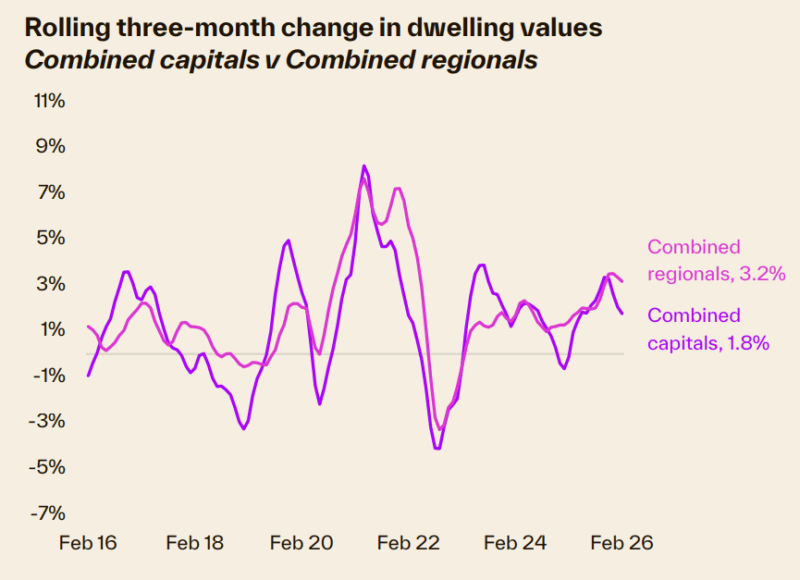
While Sydney and Melbourne have traditionally led Australia’s housing cycles, there have also been periods where the market has moved in a counter-cyclical way.
The clear slowdown in housing conditions across Sydney and Melbourne could signal an easing in growth conditions elsewhere down the track, but for now, the mid-sized capitals continue to see support from extremely low inventory levels, which is boosting the growth in values.
In the four weeks to February 22, Perth listings remained 48% below their five-year average, with Brisbane 31% below and Adelaide 23% lower.
Advertised stock levels are also low in Sydney and Melbourne, but ‘only’ 1.0% and 4.3% down on five-year average levels respectively.
Additionally, Sydney and Melbourne have seen a clear pickup in the flow of new listings through February, with freshly advertised stock 9.7% above the five-year average in Sydney and almost 12% higher than average in Melbourne.
Vendors are looking more motivated in Sydney and Melbourne, possibly looking to beat a further softening in selling conditions as clearance rates ease and demand slows.
If the typical seasonal pattern holds, the flow of new listings is likely to strengthen leading into Easter.
Delving a bit deeper into the trends shows the more affordable end of the market is still delivering some strength
In Sydney, for example, lower quartile house values were up 0.8% over the month, while upper quartile house values dropped 0.9%.
The same trend, to different extents, is evident across each of the capital cities.
There is a lot of competition for lower-priced properties.
First home buyers, investors and subsequent buyers are all competing across this sector of the market, while credit is less available across the higher price points due to serviceability constraints.
Regional markets are showing a similar trend, outperforming the capitals across New South Wales, Victoria, South Australia and Tasmania, with demand more resilient thanks to lower price points and evidence of rising internal migration rates.
Outlook
While some support for housing values remains in place, the headwinds facing demand have become more prominent, particularly around affordability, credit availability, and household confidence.
Affordability remains one of the most significant influences on the housing sector, deflecting demand towards lower- riced markets.
Dwelling values remain elevated relative to household incomes, and the February rate hike has further eroded borrowing power and repayment capacity.
With the average loan size for a new mortgage approaching the $700k mark, serviceability pressures have intensified amid higher interest rates and renewed cost-of-living pressures.
This dynamic is increasingly limiting the depth of demand at higher price points, where prospective buyers are likely to find it harder to demonstrate an ability to service a mortgage, especially with a three-percentage point serviceability buffer in place.
At the same time, income growth has weakened in real terms, with wages growth falling into negative territory once adjusted for inflation.
This decline in real purchasing power is constraining households’ ability to absorb higher mortgage repayments and will likely contribute to more cautious purchasing behaviour.
Population growth has also largely normalised, removing a key demand tailwind that supported housing activity in recent years.
- Also read:National Weekly Auction Report – March 21st 2026 | Auction Markets Down Again Following Latest RBA Rate Increase

- Also read:Perth housing market update | March 2026

- Also read:Adelaide housing market update | March 2026

- Also read:Brisbane housing market update | March 2026

- Also read:Regional Property Is Booming… But Should Investors Be Careful? | Property Insiders

Regulatory settings have become more restrictive at the margin.
APRA’s implementation of a 20% limit on high debt-to-income (DTI) lending from February 1 isn’t expected to influence the headline housing outcomes, but highly leveraged households will find housing credit is less available.
With annual credit growth for investor home lending tracking at the fastest rate since 2015, this could be another watch area for APRA if the speed of investor credit growth doesn’t slow.
Consumer sentiment has also softened, with confidence declining over the past three months.
While housing activity has not yet shown a pronounced response, weaker confidence typically translates into more conservative decision-making, longer purchasing timeframes and reduced willingness to stretch household balance sheets.
Despite these demand-side headwinds, several factors continue to underpin housing values.
Supply remains persistently constrained across most markets, limiting the extent of any downside risk.
While construction activity has begun to lift, overall dwelling supply remains insufficient relative to underlying demand,
particularly in established capital city markets.
There are, however, early signs that new housing supply is starting to improve.
Building approvals and commencements have increased in some states, most notably Western Australia, South Australia, and Queensland, above the decade average and trending higher.
In addition, new listing activity has picked up in Sydney and Melbourne, suggesting that vendors are becoming more active as market conditions stabilise.
While this increase in listings could help to ease some of the most acute supply pressures, advertised stock levels remain low across every capital city by historical standards.
Labour market conditions remain a key support for housing demand.
Employment remains high and the jobs market is tight, helping to underpin household income security and mortgage
serviceability, even as real wages have come under pressure.
This environment reduces the likelihood of forced selling and supports market stability.
Targeted policy support is also providing some offset to broader affordability challenges.
The 5% deposit guarantee continues to support first home buyer participation, particularly in more affordable segments of the market where deposit constraints remain a key barrier to entry.
Overall, housing market conditions in early 2026 appear finely balanced.
We continue to see scope for some further upward pressure on housing values, although growth is likely to be modest
and increasingly uneven across market segments.
Price growth is expected to be most evident at the lower end of the market, where competition among buyers is concentrated and policy support is most effective.
In contrast, higher-priced segments are likely to show softer outcomes due to less demand amid serviceability constraints.
This pattern points to a market that is becoming more segmented, with housing outcomes increasingly shaped by affordability thresholds and access to credit.
This theme is likely to remain a defining feature of the housing market through 2026.


