Key takeaways
Sydney Property Prices Are Rising Again - Sydney real estate values are increasing in 2025 following the RBA’s interest rate cut. Buyer sentiment has improved, creating fresh momentum in the housing market.
Population Boom Driving Housing Demand - With over 650,000 new residents expected to move to Sydney by 2034, strong population growth is fuelling long-term demand for residential property.
Sydney Rental Market Remains Extremely Tight - Vacancy rates are at record lows, leading to rising weekly rents and attractive rental yields for savvy property investors targeting the right suburbs.
Fragmented Property Market: Choose Wisely- Not all properties are equal—A-grade homes and investment-grade apartments in Sydney’s inner and middle-ring suburbs are outperforming the broader market.
Smart Investors Are Taking a Strategic, Long-Term View - Despite high property prices and affordability concerns, Sydney remains one of Australia’s best long-term property markets when approached with a strategic investment plan.
Thinking of investing in Sydney property?
You’re not alone—but that doesn’t mean it’s easy.
"Sydney's too expensive."
"You’ve missed the boat."
"Now’s not the time to invest."
These are just a few of the myths floating around dinner tables and social media feeds.
But here’s the truth: in every market cycle, there are opportunities—if you know where to look.
Sydney isn’t just Australia’s most iconic city—it’s also one of the most resilient real estate markets in the world.
In this updated guide, I’ll show you why smart money is quietly flowing into Sydney again in 2025, the suburbs leading the next wave of growth, and how to invest with confidence.
When the RBA cut interest rates in February and Sydney property market sentiment improved and Sydney property values started rising again.
Now if you think Sydney is already full, it's going to get more crowded in the next 10 years.
NSW will have nearly 1 million more people by 2034, with more than 650,000 of them living in Sydney and this will only put more pressure on an undersupplied Sydney property market.
Here is the latest data on the median property prices for Sydney.
| Property | Median price | Δ MoM | Δ QoQ | Δ Annual |
|---|---|---|---|---|
| All Capital city dwellings | $1,224,341 | 0.8% | 1.7% | 2.1% |
| Capital city houses | $1,521,611 | 0.9% | 2.0% | 2.9% |
| Capital city units | $873,838 | 0.6% | 0.9% | 0.0% |
| Regional dwellings | $774,168 | 0.2% | 0.7% | 3.8% |
Source: Cotality, 1st September 2025
According to CoreLogic, Sydney property price growth has slowed significantly over the last few months, but despite this deceleration, Sydney house prices have risen 27.7% since the onset of Covid, however Sydney dwelling prices fell -0.6% in December.
As I said above, this is now reverse with the first fallen interest rate bringing back by and seller confidence and the latest data shows prices are only -1.4% below their previous peak… so a new records will be set soon.
Of course, there is not "one" Sydney housing market and some areas are strongly outperforming others.
It's a bit like having one hand in a bucket of hot water and the other in a bucket of cold water and saying: On average I'm feeling comfortable.
Here's the forecast for Sydney property prices in 2025-26
Domain’s latest Price Forecast Report for FY25-26 reveals that Australia’s property market is expected to see continued price growth over the next 12 months, with major capital cities Sydney and Melbourne driving national trends.
Unlike the turbocharged growth of the post-COVID boom or the sharp rebounds of past rate-cutting cycles, this future upswing will be defined by subtle shifts in momentum, affordability limits, and policy intervention.
The range of capital city price growth is expected to narrow with Sydney forecast to lead with 7% annual growth, as the Sydney property market typically respond more quickly to interest rate changes.
Meanwhile, Adelaide and Perth – standout performers over recent years – are expected to experience slower positive growth as affordability constraints intensify.
Brisbane unit prices are expected to moderate from the previously unsustainable double-digit growth, while house prices continue to grow at a pace similar to that of last year.
Domain's House price forecasts
|
HOUSES | STRATIFIED MEDIAN PRICE |
||||||
| ANNUAL CHANGE | LEVEL | RECORD | BELOW PEAK | |||
| Capital City | FY25 | FY26 | FY25 | FY26 | FY26 | FY26 |
| Sydney | 4% | 7% | $1,717,107 | $1,829,576 | YES | |
| Melbourne | 0% | 6% | $1,046,246 | $1,112,623 | YES | |
| Brisbane | 5% | 5% | $1,037,357 | $1,093,414 | YES | |
| Adelaide | 12% | 4% | $1,013,204 | $1,049,117 | YES | |
| Canberra | -2% | 4% | $934,225 | $981,808 | NO | -7% |
| Perth | 7% | 5% | $934,225 | $981,808 | YES | |
| Combined capitals | 4% | 6% | $1,194,942 | $1,264,614 | YES | |
Domain's Unit price forecasts
| UNITS | STRATIFIED MEDIAN PRICE | ||||||
| ANNUAL CHANGE | LEVEL | RECORD | BELOW PEAK | |||
| Capital City | FY25 | FY26 | FY25 | FY26 | FY26 | FY26 |
| Sydney | 3% | 6% | $835,819 | $888,822 | YES | |
| Melbourne | -3% | 5% | $555,522 | $584,400 | NO | -3% |
| Brisbane | 12% | 5% | $670,798 | $701,490 | YES | |
| Adelaide | 10% | 3% | $568,000 | $586,366 | YES | |
| Canberra | -13% | 3% | $531,784 | $546,265 | NO | -15% |
| Perth | 12% | 6% | $519,551 | $552,487 | YES | |
| Combined capitals | 3% | 5% | $680,568 | $717,266 | YES | |
History suggests that once rates start falling, property prices don’t wait around.
Bank of Queensland chief economist Peter Munckton has crunched four decades of data which was reported in the Financial Review and said a 10 to 15 per cent price rise over the next two years is a reasonable bet – no matter how many cuts the RBA ends up delivering.
Munckton explained...
“There were smaller price rises in both the early 1980s and 1990s.
But on both those occasions, the unemployment rate was above 10 per cent.
Currently, the unemployment rate is within touching distance of 50-year lows,”
On the flip side, Munckton says the extraordinary 20 per cent-plus gains seen in the ’80s, ’00s and during the pandemic also seem off the cards over the next couple of years

Tip: The expansion of the first homebuyer support will add further fuel to our housing markets
From January 1 2026, virtually all first home buyers will be able to enter the market with just a 5 per cent deposit, via a taxpayer-backed guarantee.
This part of his election promise, prime minister Anthony Albanese promised to turbocharge the program by scrapping the $125,000 income cap, making it available to an unlimited number of applicants instead of just 35,000 per year, and dramatically raising property price thresholds.
A separate promise to build 100,000 new homes was also made – but that extra supply could take years to arrive, if it arrives at all.
Sydney rents set to surge
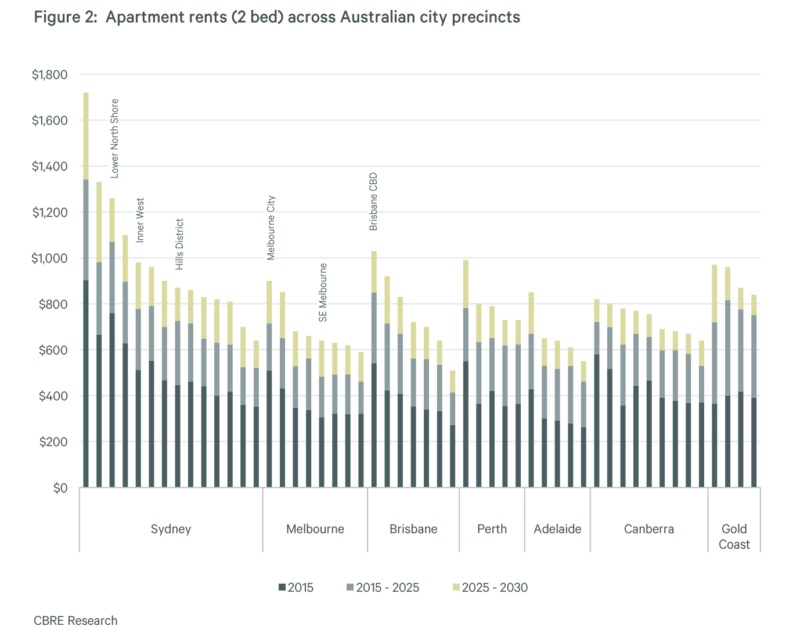
Median apartment rents are likely to grow by 24% between 2025 and 2030 across Australian capital cities, according to the latest report by International Property Consultancy, CBRE.
CBRE estimates apartment delivery in Sydney will average 11,700 p.a. over 2025-30, well below 30,000 p.a. demand for total housing stock and this means vacancy rates are set to fall from 2.0% to 1.2% and rents will rise by 24% .
You can always beat the averages.
While it’s likely that Sydney property price growth will take off in the second half of 2025, the good news is that you can always beat it by investing in the right property in the right location.
Now by that, I don’t mean look for the next hotspot.
I mean buying quality properties in locations that will outperform in the long term such as gentrifying suburbs.
You see...property offers countless opportunities to improve your results through your own time, skills and knowledge – so you don’t need to settle for average.
And there’s more to it than just location. You can add value through refurbishment, or redevelopment.
Why Sydney Still Offers Stellar Investor Value (Even at a $1.5M Median)
Maybe you're wondering whether there is still investment value at the current Sydney property prices.
Here's a quick summary why I believe there is good long-term value in Sydney real estate.
1. Rent Pressures and Tight Vacancy = Yield Opportunity
Despite the current median prices, Sydney’s rental market remains rock-solid.
Vacancy rates sit well below 1% across much of the city, and rents are rising fast—two-bedroom apartments in Coogee, for instance, have surged over 20% in just the past year.
That tight rental environment boosts cash flow and helps offset high entry prices.
2. A Two-Speed Market Presents Selective Upside
There is not one Sydney property market - it’s fragmented.
A‑grade family homes in lifestyle-rich suburbs (inner west, eastern suburbs, Northern Beaches) continue to draw fierce competition and strong results.
In contrast, oversupplied high-density precincts like parts of Parramatta, Homebush and Zetland are best avoided.
3. Boutique, Lifestyle-Oriented Apartments Are Under Replacement Cost
Well‑located, small-scale apartments with charm and family appeal are trading below replacement cost—and backed by lifestyle demand, they deliver resilience and value over time.
4. Outer-West Growth Corridors Are Poised for Capital Appreciation
Affordable suburbs in Western Sydney—like St Marys, Fairfield, Liverpool—are enjoying fast growth, often 6–7% year-on-year, thanks to infrastructure investment (especially the Western Sydney Airport) and solid owner-occupier demand.
These corridors are delivering real scope for both capital growth and rental demand.
5. Forecasts Hint at Solid Growth Ahead
Domain’s latest forecasts ( which I have quoted above ) expect Sydney to lead national growth in FY 2025–26—around 7% for houses and 6% for units—fuelled by rate cuts and strong underlying demand.
6. Investor Equity Cushion Softens Risk
Sydney homeowners often hold considerable equity, which buffers market dips and adds resilience. With interest rates likely to keep falling, equity-rich investors are well-placed to re-enter or upgrade, supporting demand and pricing recovery.
Sydney property market update
At Metropole Sydney we’re finding that strategic investors and homebuyers are back actively looking to upgrade, picking the eyes out of the market.
While the high end of the Sydney property market led this new phase of the property cycle in 2023, more recently cheaper properties are recording stronger price growth.
Buyer and seller confidence will increase as interest rates keep falling over the next year or two, and buyers will return to the Sydney property market.
However, affordability will still be an issue for many potential buyers, and buyers will only be able to pay up to the limit of what they can afford, so I would only invest in locations where wages are increasing faster than average and residents have multiple streams of income, not just wages.
This means investing in the more affluent inner-ring suburbs and the gentrifying middle-ring suburbs of Sydney which will outperform the cheaper suburbs, where residents will still find it difficult to afford to buy a home.
The best-performing residential investment properties in Sydney for 2025
It's likely that certain types of properties will outperform others in Sydney in 2025 fuelled by demographic shifts, evolving lifestyle preferences, and economic factors.
Family Homes in Premium Suburbs
The ongoing preference for space, especially among families, means demand for quality houses in established, affluent suburbs will remain high.
While Sydney's median house prices are steep, well-positioned family homes in prestigious areas continue to offer solid long-term capital growth.
Investors should look for 3-4 bedroom houses on sizable blocks in well-established neighbourhoods with access to good schools, amenities, transport links, and green spaces.
Eastern suburbs like Randwick, Coogee, and Maroubr continue to be sought after by families due to their proximity to the CBD, beaches, quality schools, and lifestyle amenities. They offer strong long-term growth and steady rental demand.
In the Lower North Shore investors should consider Willoughby, Lane Cove, and Artarmon. These family-friendly suburbs with excellent schools, green spaces, and easy access to the city are perennial favourites among renters and home buyers alike.
On Sydney’s Northern Beaches the suburbs of Dee Why, Mona Vale, and Freshwater attract families looking for a relaxed lifestyle close to the beach, good schools, and outdoor activities. They offer strong growth potential as more people prioritise lifestyle and work-from-home options.
Townhouses in Middle-Ring Suburbs
Townhouses represent an increasingly popular choice for both investors and owner-occupiers due to their affordability relative to standalone houses and the lifestyle advantages they offer.
With Sydney's shift towards medium-density living, townhouses are expected to remain in demand, especially in middle-ring suburbs experiencing gentrification.
Investors should target 3-4 bedroom modern townhouses in low-density developments with a focus on functional living spaces, private courtyards, and proximity to amenities.
Sydney’s Inner West offers excellent opportunities for townhouse investments. The suburbs of Marrickville, Dulwich Hill, and Petersham offer a vibrant culture, proximity to the CBD, and ongoing gentrification.
These suburbs are popular with young professionals and families looking for a balance between urban living and suburban space.
In the St George area Hurstville, Kogarah, and Carlton have been experiencing significant growth due to infrastructure upgrades and its proximity to Sydney’s CBD and airport. The demand for townhouses in these suburbs is strong, particularly among families and professionals.
Sydney’s North-West growth corridor has become an attractive location for townhouse investments. Rouse Hill, Kellyville, and Castle Hill are areas worth considering, with expanding infrastructure, shopping centres, and schools, these suburbs offer a blend of affordability, accessibility, and lifestyle.
Boutique Apartments in Lifestyle Hubs
I would avoid high-density apartment developments, but boutique “family friendly” apartments in lifestyle hubs have proven resilient over the last few years and are likely to to continue to outperform in the future as currently investors can buy established apartments considerably below replacement cost.
The key is to target smaller, low-rise complexes in vibrant areas where demand from young professionals, students, and downsizers remains high.
Look for spacious, high-quality 1-2 bedroom apartments with balconies, modern finishes, and access to cafes, restaurants, and public transport.
Boutique apartments in Sydney’s eastern suburbs of Bondi, Bronte, and Coogee always attract high demand due to their proximity to the beach, CBD, and a plethora of dining and shopping options.
Quality apartments with ocean views or easy beach access will always outperform.
Investors should also consider apartments in the inner suburbs of Surry Hills, Darlinghurst, and Redfern.
These lifestyle-focused suburbs are popular with young professionals and couples seeking a vibrant, urban lifestyle close to work, dining, and entertainment.
Apartments in well-designed, low-rise developments here continue to offer strong rental yields and capital growth.
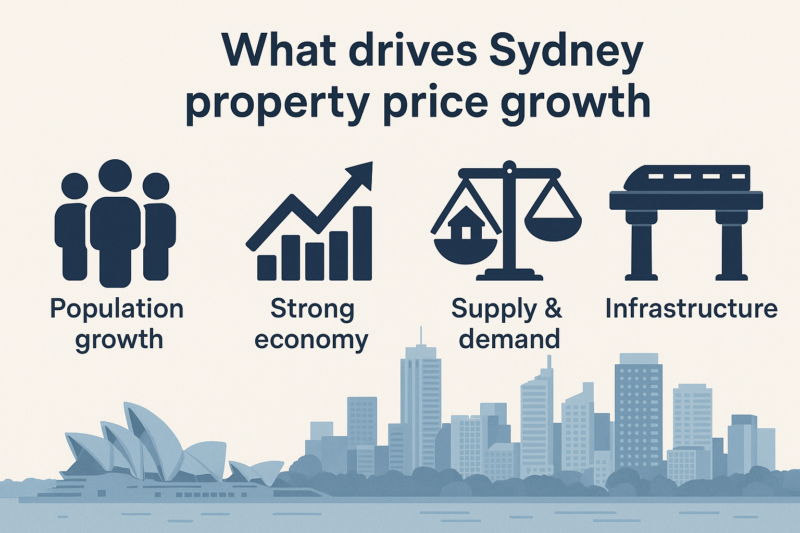
What's happening in the Sydney property market?
While Sydney property buyers are back in force, they are currently being cautious - their pockets are shallower and borrowing capacity significantly reduced.
But more investors are getting into the Sydney market now recognising that there is a current window of opportunity and that in 12 months’ time, the properties they purchased today will look like a bargain.
However, despite the overall caution, buyer demand is still strong which will continue to push Sydney’s property market through its revival.
Sellers are also coming back to the market with total property listings for Sydney marginally higher than in the same month last year, although the stock of older listings is slimmer so overall supply remains constrained.
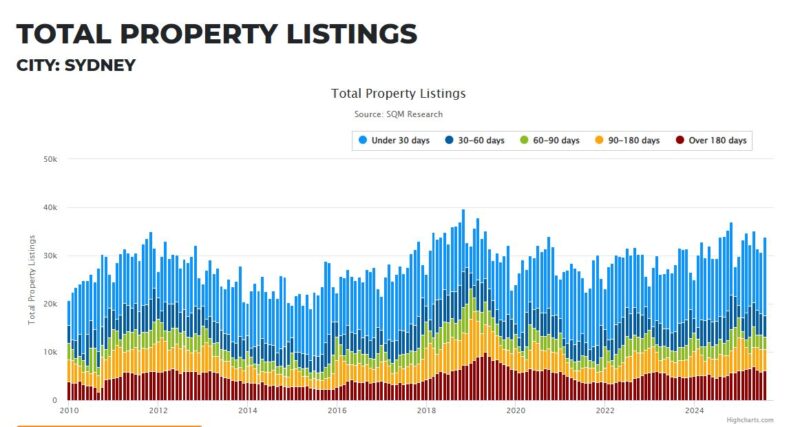
Source: SQM Research
Sydney’s auction clearance rates are a good indicator of the depth of buyer and seller sentiment and auction clearance rates have been consistent throughout 2024, but as you can see from the following chart, they slowed down at the end of 2024 in line with falling buyer demand.
While the data is insightful, as we know, Sydney’s market is not a one-size-fits-all property market.
There is a clear flight to quality with A-grade homes and investment-grade properties still in short supply for the prevailing strong demand, but B-grade properties are taking longer to sell and informed buyers are avoiding C-grade properties.
After all, some of the city’s suburbs are so tightly held that an available property for sale comes around once in a blue moon with homeowners holding onto their houses for as long as 20 years.
And areas in lifestyle or coastal suburbs are still in particularly strong demand as homebuyers wait to secure their dream property.
At Metropole Sydney, we’re finding that strategic investors are looking to take advantage of the window of opportunity currently available to them, while homebuyers are still actively looking to upgrade, picking the eyes out of the market.
While overall Sydney property values are likely to gain some more ground, like all our capital cities there is not one Sydney property market, and A-grade homes and investment-grade properties remain in strong demand and are likely to outperform, many holding their values well.
In other words, the various sectors of the Sydney property markets will be fragmented, which is a more “normal” property market.
Sydney’s rental markets remain exceptionally tight
Vacancy rates in Sydney’s rental market are traditionally very tight, usually hovering well below the national baseline.
But thanks to soaring demand and severe undersupply in the rental market, the national vacancy rate is exceptionally low today by historical standards.
SQM Research recorded Sydney’s vacancy rate has crept up a little to 1.7%.
By comparison, the vacancy rate which represents a balanced market is around 2.5%.
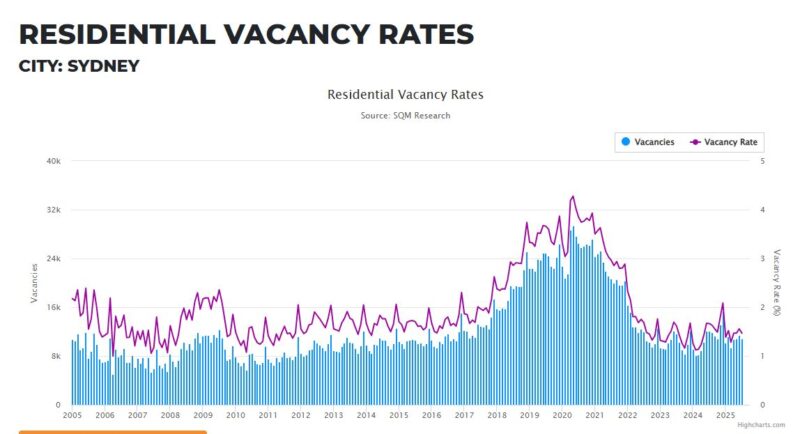
Source: SQM Research
This shows us that, like everywhere else in the country, Sydney’s rental market has plunged into crisis, with record-low vacancy rates, high rent prices, strong demand, and a rising population putting the city’s market into a pressure cooker environment.
And the data for vacancy rates and also weekly rent listings highlights that the distressing state of Sydney’s rental market leads to a bleak outlook for renters.
And at Metropole Property Management our vacancy rate is less than half the industry rate, in part because our clients have chosen investment-grade properties, but we'd like to think it also has a bit to do with our proactive property management policies.
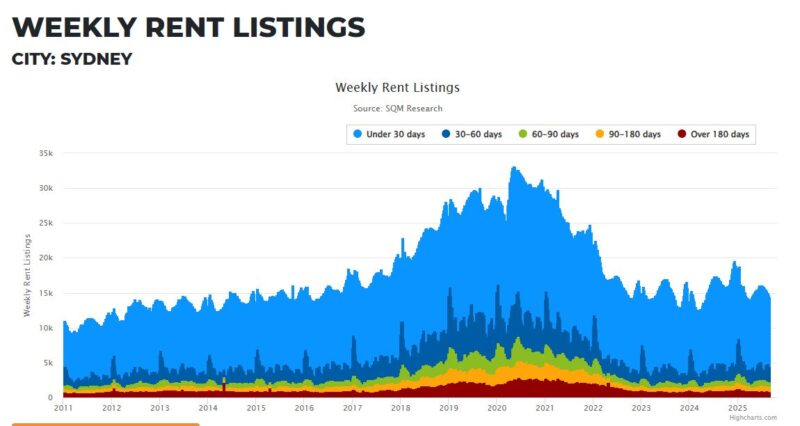
Source: SQM Research
Sydney has been facing a rental housing shortage for several years now.
This has led to increased competition for available homes, driving up rentals and making it increasingly difficult for many Australians to afford a place to live.
One of the aspects of the housing market boom during the pandemic was that it was driven by owner-occupier buyers.
And since Australia’s international borders in early 2022, Sydney has become a major recipient of new residents, both skilled immigrants and overseas students, putting extra pressure on the Sydney property market, particularly the rental markets.
The current metro area population of Sydney in 2024 is 5,185,000, a 1.25% increase from 2023. The metro area population of Sydney in 2023 was 5,121,000, a 1.27% increase from 2022.
If you think Sydney is already full, it's going to get more crowded in the next 10 years.
NSW will have nearly 1 million more people by 2034, with more than 650,000 of them living in Sydney, according to the latest NSW population projections.
And this will only serve to put even more pressure on Sydney’s rental crisis.

We're just not building enough dwellings in Sydney
Australian Bureau of Statistics (ABS) data shows NSW dwelling approvals declined in June by an appalling 19%.
The 1,597 private houses approved in June is the lowest recorded figure for NSW since January 2013, according to the ABS.
These figures highlight the dire, and worsening, housing crisis in NSW:
- Through immigration, the NSW population is increasing by over 15,000 people each month (source: ABS);
- The average growth in the number of properties rented since September 2023 is 218 per month (source: NSW Rental Bonds Board);
- The total number of dwelling units approved in NSW fell by a disastrous 18.8% in June 2024, including a 19% fall in private houses.
REINSW CEO Tim McKibbin explained:
“The housing crisis continues to deteriorate on the back of a perfect storm of inhibitive taxation, approval delays and rental reforms which discourage investment.
Demand is rising fast and the supply gap is widening at an increasing rate.
These are perfect storm conditions which must be reversed now.
To do so, a new approach is needed. Government must stop driving investors out of the residential market through anti-landlord reforms. These reforms reduce rental supply and compound the dire situation for tenants.
Government must urgently consider property taxation reform. The cost of new property is inflated by 40% through taxes and charges imposed by various levels of Government. It’s preventing new supply at a time when we desperately need more homes.
Delays in development approvals must be eradicated. Councils which fail to meet their housing quotas should have their planning powers revoked by the NSW Government. We have run out of time for excuses.
Key trends that will shape Sydney’s housing market in 2025
Suburbs benefiting from major infrastructure projects, such as new transport links, hospitals, or shopping precincts, are likely to outperform. These investments often lead to increased demand and rising property values.
Areas undergoing gentrification, where older properties are being renovated and lifestyle amenities are improving, often provide excellent capital growth opportunities. Look for signs such as new cafes, restaurants, and young families moving in.
Target suburbs with strong population growth driven by immigration, young professionals, or families, as this is a clear indicator of rising demand for both rental and owner-occupied properties.
Investing in Sydney's property market in 2025 offers significant opportunities, but it's crucial to choose the right property type and location.
Sydney's strong pace of growth has been remarkable in the face of the substantial deterioration in affordability that occurred with the sharp rise in interest rates.
It is also a testament to the strong demand aided by the pick-up in population growth, and limited supply that offset the effects of higher rates.
And, likely, the lack of supply of good properties at a time of increasing demand from homebuyers and investors and strong immigration will push Sydney property values higher throughout this year.
However, the Sydney property market will remain fragmented with the more affluent suburbs where people's incomes are higher, and homeowners have substantial equity in their properties outperforming the cheaper suburbs which are being harder hit by the rising cost of living and interest rates.
Top 10 NSW suburbs where property has earned more than the average worker
Property prices in New South Wales grew 9.6% over the last year and the top performers are all located in Sydney’s most affluent areas, but western suburbs also made the very top of the list.
The eastern suburbs of Bellevue Hill and Vaucluse saw the highest year-on-year growth in property values, with an average increase of more than a million dollars.
Meanwhile, in the inner-west regions, houses in Strathfield and Abbotsford saw year-on-year price growth of $447,417 and $401,327, respectively.
Also out west of the CBD is Oatlands near Parramatta, which earned $312,909 for the year, and West Ryde and nearby Melrose Park which notched up $305,455 and $301,676 in price rises respectively.
Further down the affordability scale, houses in Condell Park and Wiley Park in Sydney's southwest still outperformed the average Australian wage, growing by $99,953 and $98,507 respectively.
Top 10 property earners in Sydney
| Suburb | Region | AVM 12 months ago | Current AVM | Change ($) |
|---|---|---|---|---|
| Bellevue Hill | Sydney - Eastern Suburbs | $7,917,472 | $9,230,311 | $1,312,840 |
| Vaucluse | Sydney - Eastern Suburbs | $7,957,341 | $8,980,058 | $1,022,717 |
| Dover Heights | Sydney - Eastern Suburbs | $6,137,873 | $6,944,833 | $806,960 |
| Rose Bay | Sydney - Eastern Suburbs | $5,620,247 | $6,125,406 | $505,159 |
| Strathfield | Sydney - Inner West | $3,114,452 | $3,561,869 | $447,417 |
| North Bondi | Sydney - Eastern Suburbs | $4,083,836 | $4,512,973 | $429,137 |
| South Coogee | Sydney - Eastern Suburbs | $3,375,920 | $3,802,614 | $426,695 |
| Bronte | Sydney - Eastern Suburbs | $5,034,836 | $5,448,932 | $414,096 |
| Abbotsford | Sydney - Inner West | $2,753,167 | $3,154,494 | $401,327 |
| Clontarf | Sydney - Northern Beaches | $4,977,224 | $5,378,500 | $401,276 |
Source: PropTrack / realestate.com.au
Ready to Invest in Sydney?
If you’re looking to grow your wealth safely and strategically, now’s the time to talk to the team at Metropole Sydney.
Our Sydney-based buyer’s agents and property strategists understand this market inside out—and we’re here to help you make the right move.
👉 Click here to schedule your complimentary Wealth Discovery Chat


