

Key takeaways
The average commuter now loses 2 days and 11 hours a year stuck in traffic, costing about $2,788 per person and more than $10.1 billion nationally in lost productivity and wasted fuel.
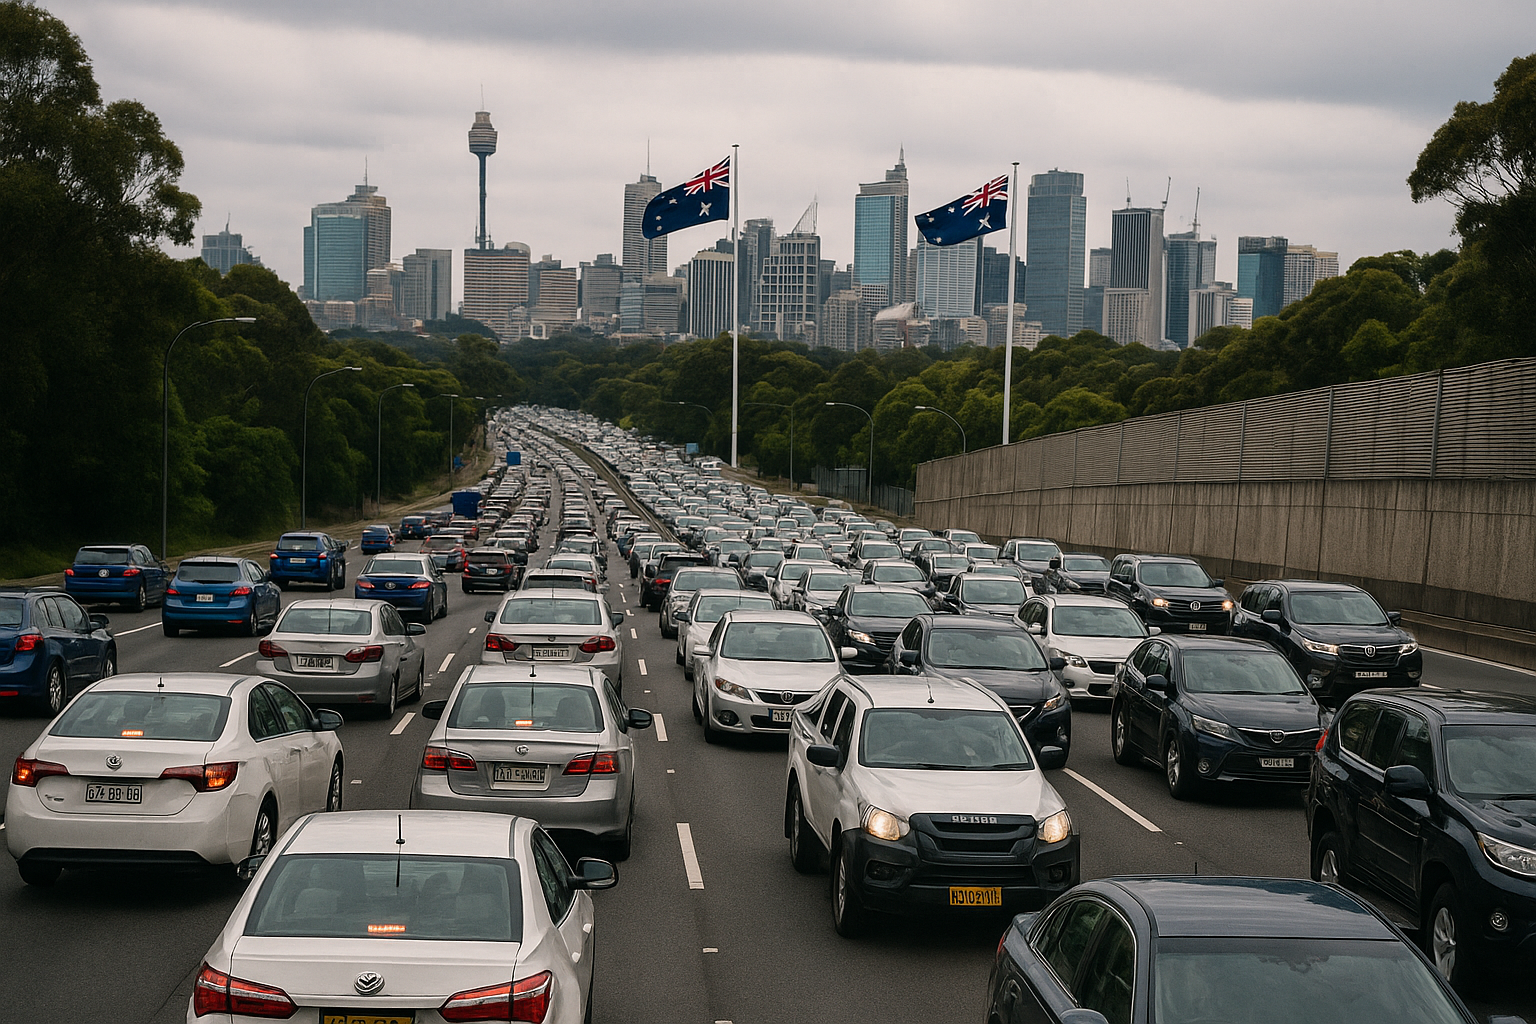
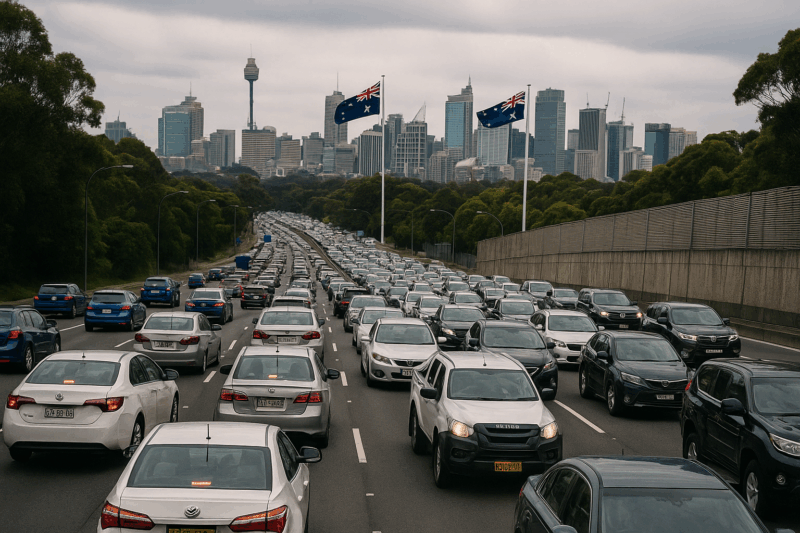
Sydney drivers lose over four full days a year to congestion, the highest in the nation, while Melbourne commuters lose almost four days, putting both cities at crisis levels despite work-from-home arrangements.
As property prices rise, more Australians are living 25–50km from major job hubs. This “drive until you qualify” trend is a major contributor to increasing travel times.
Suburbs with strong transport links, job proximity, walkability and lifestyle amenities will continue to attract a premium. Inner- and middle-ring locations are the structural winners.
Projects like the Sydney Metro, Melbourne's Suburban Rail Loop, and Brisbane’s Cross River Rail will heavily influence accessibility — and therefore, future property values.
If you feel like your daily commute is getting longer, more frustrating, and more expensive, you’re not alone.
New research reported by realestate.com.au, combining data from the ABS and Census, confirms what many of us experience every morning on the road: Australia’s congestion problem has quietly grown into a major economic and social issue, and it’s being fuelled by our housing market.
And that’s the part too many commentators overlook.
You see...traffic isn’t just about cars and roads, it’s about where Australians can afford to live, how our cities are expanding, and what that means for future property values.
And right now, the numbers tell a story we can’t ignore.
The shock numbers: how much time Australians are really losing
The report published in realestate.com.au paints a pretty confronting picture.
Across our eleven largest cities:
-
Full-time workers collectively lose 212 million hours a year to traffic.
-
That translates into $9.7 billion in productivity lost annually.
-
Add another $462 million in wasted fuel, and congestion is costing the nation over $10.1 billion every year.
-
Individually, the average driver now loses 2 days and 11 hours annually just sitting in traffic.
-
And the personal cost? About $2,788 per commuter, per year.
And this is before you factor in the intangible costs: stress, fatigue, less family time, fewer hours to exercise, social friction, and of course the environmental footprint.
When you zoom out, we’re not just talking about a commuting headache - this is a structural drag on Australia’s future productivity, competitiveness and liveability.
Why congestion is getting worse — and why the property market is part of the puzzle
The research is clear: congestion is rising even though more Australians than ever are working from home at least part of the week.
In Sydney, for example, the average full-time worker works from home 1.3 days per week, yet still loses over four days annually to gridlock, because workers are being pushed further out. Much further.
As prices rise sharply in the inner- and middle-ring suburbs, where jobs, transport and amenities are concentrated, many families simply can’t buy nearby.
So they compromise by buying more than 25km, sometimes even 40–50km out of the CBD.
This “drive until you qualify” trend is now a defining feature of Australian housing. But it’s also one of the quiet drivers of our worsening congestion.
In short, distance is the hidden cost of affordability.
And tens of thousands of Aussies are now paying for that cost every single morning.
Which cities are losing the most time in traffic?
Let’s break this down city by city, because congestion isn’t affecting all markets equally.
1. Sydney
Sydney commuters lose 4 days and 25 minutes annually, the worst result in the nation.
Here’s the surprising part:
-
Sydney has the 5th shortest average commute distance (20.6 km)
-
Yet it has the longest time lost
A typical daily round trip should take around 65 minutes in free-flowing conditions.
Instead, it blows out to 100 minutes during rush hour — an extra 34 minutes per day.
This is the cost of a city where housing affordability is at crisis levels and geography (harbour, national parks, limited corridors) constrains expansion.
For property investors: This reinforces why Sydney’s tightly held inner and middle ring suburbs continue to outperform. The scarcity is real. The demand is unrelenting. And the alternative, a multi-hour commute, is becoming unbearable for many.
2. Melbourne
Melbourne commuters lose 3 days, 22 hours and 5 minutes annually, only slightly behind Sydney.
Drivers lose 33 minutes and 22 seconds per day beyond free-flow travel.
Peak congestion in Melbourne is being driven by:
-
explosive population growth
-
massive housing construction on the outer edges
-
jobs still heavily concentrated in a central core
-
infrastructure struggling to keep up
And even though Melbourne is more spread out than Sydney, job decentralisation has not kept pace with population decentralisation.
This is why the middle-ring, especially gentrifying areas around key job corridors, continue to shine for long-term capital growth.
3. Adelaide
Adelaide sits third for total time lost: 3 days, 5 hours and 50 minutes.
But it takes the top spot for how painfully slow peak-hour driving is.
A simple 10km round trip takes 55 minutes and 45 seconds on average.
Peak driving speeds drop to 21–22 km/h, among the slowest in the country.
Adelaide’s congestion highlights an interesting point: Even “affordable” cities are not immune from bottlenecks when housing growth outpaces infrastructure modernisation
4. Brisbane
Brisbane commuters lose 3 days, 1 hour and 46 minutes each year.
Brisbane’s challenge is rapid population growth driven by interstate migration and affordability relative to Sydney and Melbourne.
Add in major construction around Olympic-related upgrades and you get a network under pressure long before 2032 rolls in.
5. Perth
Perth drivers lose 2 days, 21 hours and 35 minutes annually.
Perth has historically enjoyed a reputation for smoother traffic flows due to its freeway network and lower density.
But post-pandemic population surges and construction delays have added noticeable friction.
Other major centres with significant congestion include:
-
Newcastle
-
Gold Coast
-
Hobart
- Also read:Everything you need to know about the state of Australia’s property markets in 20 charts – April 2026

- Also read:National Weekly Auction Report – April 11th 2026 | Auction Markets Steady After Easter with School Holiday Listings

- Also read:Latest Property Asking Prices State by State | National Listings Rise in March
- Also read:Rents Surge Again as Interest Rates Bite – What Happens Next?| | Property Insiders

- Also read:Latest Property Price Forecasts Revealed. Australian Property Market Outlook 2026: Where To Now After The Rate Rise.

- Also read:Everything you need to know about the state of Australia’s property markets in 20 charts – April 2026
-
Canberra
-
Wollongong
-
Darwin
Darwin stands out with the lowest congestion: less than 1.5 days lost annually, thanks to its smaller population and road structure.
Across all major cities, the average driver loses about 15 extra minutes per day versus optimal travel conditions.
The big question: what do these numbers mean for property investors?
This is where things get interesting.
Traffic data isn’t just a transport statistic. It’s a behavioural indicator that shows how people live, how they move, and how their preferences change over time.
Here are the key insights you can take to the bank (literally):
1. Liveability drives value, and commute time is core to liveability
Buyers and renters will increasingly pay a premium to:
-
live closer to work
-
access efficient public transport
-
cut commute times
-
reduce dependency on cars
-
walk to amenities
This strengthens the case for well-located inner- and middle-ring suburbs.
2. “Commute fatigue” will become a major driver of buyer behaviour
As congestion worsens, more Australians will prioritise “time-rich living.”
This means:
-
Suburbs with shorter commutes will outperform
-
Buying further out will become less attractive
-
Younger Australians will delay outer-suburb homeownership if it means two hours in the car each day
-
Downsizers will increasingly sell outer-area homes to move closer in
3. Infrastructure projects will reshape property value trajectories
Investors must closely watch:
-
Sydney Metro expansion
-
Melbourne Suburban Rail Loop
-
Brisbane Cross River Rail
These projects will fundamentally change accessibility and, therefore, land values.
4. The outer suburbs may remain “affordable,” but congestion becomes a long-term headwind
Yes, outer-ring property can look cheaper. But the long-term lived experience, multi-hour commutes, limited transport, poor access to jobs, creates demand volatility.
And affordability alone doesn’t create capital growth.
5. The structural winners remain the same
Long-term outperformers will be:
-
inner-ring, landlocked suburbs
-
established middle-ring areas with transport and lifestyle
-
gentrifying pockets with improving amenities
-
walkable, train-accessible neighbourhoods
-
locations near major job centres
This aligns perfectly with the investment strategy we’ve applied for decades
What this says about Australia’s future

Tip: Congestion is the canary in the coal mine.
It tells us our cities are growing faster than we’re building infrastructure.
It tells us urban planning hasn’t kept pace with population growth or housing demand.
It tells us that affordability is forcing people to trade lifestyle for price.
But it also reveals where the opportunities are.
Because if the goal for most Australians is simple: spend less time in traffic and more time living, then the suburbs that help people achieve that will command strong demand for decades to come.
Traffic congestion is about more than cars and commutes.
It’s about how Australians live, how our cities function, and where property values will move next.
The latest data confirms what investors have long understood:
Note: People will always pay a premium to buy back their time. 
And as congestion worsens, the suburbs that offer better access, better liveability, and shorter commutes will consistently outperform the broader market.
Make your decisions with that in mind, and the long-term growth will follow


