

It's time to look back and see how our auction markets performed over the last few months.
 There were 23,184 homes taken to auction across Australia's capital cities over the three months to September 2021.
This is down from 31,605 over the previous quarter, although increasing on the 14,216 auctions held over the September 2020 quarter last year.
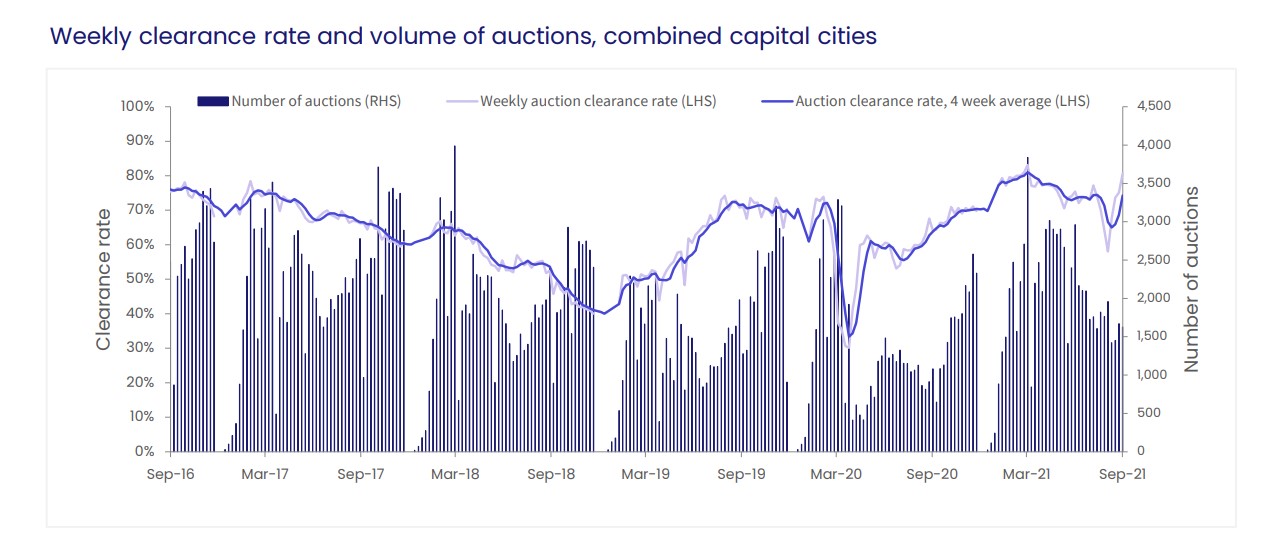
The combined capital city auction clearance rate came in at 71.7 per cent over the September 2021 quarter, down from the previous quarter when 75.7 per cent of reported auctions were successful.
The September quarter last year saw a clearance rate of 59.2 per cent.
Of the 22,980 capital city auction results collected over the latest quarter, 18.3 per cent reported a withdrawn result, which was significantly higher than the 7.3 per cent withdrawn over the June quarter.
Looking at weekly auction figures, the week ending 29th August saw the highest withdrawal rates of the quarter (35.1 per cent), which saw the clearance rate drop below 60.0 per cent for the first time since late August 2020.
The rise in withdrawals was largely attributed to Melbourne’s lockdown restrictions which at the time prevented in-person property inspections.
By the final week of the quarter (week ending 26th September), withdrawal rates had fallen to 10.2 per cent as restrictions began to ease, pushing the combined capital city final clearance rate for the week up to 80.6 per cent, the highest clearance rate recorded since late March this year.
The upward trend in clearance rates over the last 4 weeks of the quarter will likely continue into October, so long as the withdrawal rate continues to ease.
Auction Market Review Highlights


Capital city & major regional markets


Capital city sub-regions (Sydney)

Sydney sub-region summary

- Also read:Latest property price forecasts for 2024 revealed. What’s ahead in our housing markets in the next year or two?

- Also read:Adelaide housing market update | October 2024
- Also read:Where should I buy my next investment property in Australia?
- Also read:Melbourne property market forecast for 2025
- Also read:Sydney property market forecast for 2025


Despite being in lockdown for the entire September quarter, 7 of the 15 sub-regions across Sydney have seen clearance rates increase when compared to the previous quarter. 
Clearance rates above 80.0 per cent were recorded in 7 of the 15 sub-regions over the September quarter, compared to just 4 over the June quarter.
The highest clearance rate this quarter was once again recorded across the Northern Beaches region (85.3 per cent), followed by the North Sydney and Hornsby region (83.4 per cent) and the Sutherland region (81.1 per cent).
The lowest clearance rate was recorded across Parramatta (66.4 per cent). Auction volumes were down across all 15 sub-regions over the quarter, with just one sub-region holding over 1,000 auctions, compared to 6 sub-regions over the previous quarter.
The busiest subregions for auctions over the quarter were North Sydney and Hornsby (1,248), Inner South West (956), and City and Inner South (954). Overall, Sydney’s auction clearance rate over the September quarter was recorded at 78.0 per cent, compared to 78.4 per cent over the previous quarter, and 63.1 per cent over the September quarter last year.
Sydney was host to 8,535 auctions over the quarter, compared to 12,780 over the previous quarter and 8,147 over the September 2020 quarter.
Capital city sub-regions (Melbourne)

Melbourne sub-region summary

In Melbourne, all 9 sub-regions saw a fall in auction volumes when compared to the previous quarter.
The Inner region was the busiest spot for auctions over the quarter (1,790), followed by the North East (1,207), and the Inner South (1,199).
The Mornington Peninsula was the best performing sub-region in terms of clearance rates (75.4 per cent), followed by the Inner South (69.1 per cent) and the Outer East sub-regions (68.9 per cent). 
Overall, Melbourne’s clearance rate was recorded at 62.8 per cent over the September quarter, down from 73.3 per cent over the previous quarter.
In terms of auction volumes, there were 9,493 homes taken to auction across the city over the 3 months to September, compared to 13,693 over the June quarter and 3,320 over the September 2020 quarter.
Melbourne’s clearance rate over the September quarter was heavily impacted by higher than usual withdrawal rates with the city back in lockdown, which prevented in-person property inspections from taking place for much of this period.
Looking at Melbourne’s weekly auction results, the w/e 29th August saw 61.6 per cent of auctions reported as withdrawn, dragging the clearance rate down to 35.9 per cent, however now that restrictions have begun to ease, the withdrawal rate is falling.
Over the final week of the quarter (w/e 26th September) 17.2 per cent of reported auctions were withdrawn, and a final clearance rate of 75.7 per cent was recorded.
ALSO READ: Is this the beginning of the end of our property boom?


