

Key takeaways
97% of house resales and 88% of unit resales in the first half of 2025 were profitable, the highest levels for houses in nearly two decades.
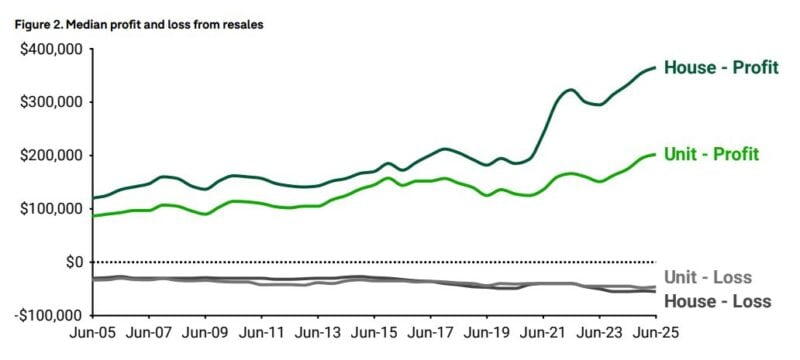
Houses remain the safer bet, with far fewer loss-making sales than units.
With owners sitting on substantial equity and few distressed sales, profit-making resales are likely to remain dominant through 2025.
The two-speed trend will persist: houses outperforming, and unit markets needing careful selection.
In a year where interest rates, inflation, and global uncertainty have dominated the headlines, Australian property sellers have still managed to walk away smiling.
The latest Domain Profit and Loss Report shows that, for most owners, 2025 has been a year of crystallising significant equity gains, particularly for those who’ve held their properties for the long term.
Let’s look at what’s happening, where the strongest gains were, and the warning signs for certain markets.
The big picture: almost everyone’s winning
We’re in one of the strongest resale markets in recent memory according to the Domain report.
Across Australia, 97% of house resales and 88% of unit resales made a profit.
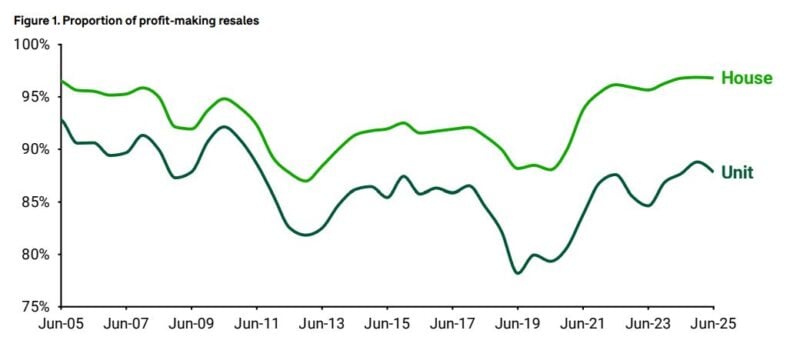
For houses, that’s the best result since 2005, and for units, the strongest since 2022.
The median gain for house sellers hit $365,000, while units delivered $202,000.
Even better, losses remain rare , fewer than 4% of houses sold at a loss (and those that did typically lost $55,000), while only 12% of units went backwards.
However the Domain report showed that holding periods before a sale are longer than they used to be: around nine years for houses and eight years for units, and that’s turbocharging returns.
Obviously staying put longer allows owners to ride out short-term bumps, capture more of the big growth years, and build up serious equity.
Key Findings from Domain's report
Houses remain the safest bet for sellers
- Brisbane and Perth lead the way with more than 99% of houses selling for a profit, the best figures nationally (see Table 1), followed by Sydney at 97.9% and Adelaide at 97.3%.
- Perth posted the biggest jump in house resale profits, up 22% year-on-year, with Adelaide close behind at nearly 20%. Sydney, despite softer growth, still delivers the highest median profit dollar value at $700,500, reflecting its premium market prices.
- Not all cities saw gains. Darwin and Melbourne recorded annual declines in house resale profits (-25.8% and -3.1% respectively), while Canberra remained flat. But even in these cities, less than 4% of houses sold at a loss nationally, with the median loss being around $55,00 - a small setback amid broad market strength.
Units see strongest returns in Perth, Brisbane and Adelaide
- Unit resale performance varied more dramatically across the capitals. Brisbane, Adelaide and Perth saw more than 97% of units selling for a profit, with Perth’s unit profits surging 55.5%, Brisbane up 40.4% and Adelaide climbing 37.4% annually.
- In contrast, Melbourne and Darwin’s unit markets lagged significantly, with only 73% and 53.4% of unit sales turning a profit, respectively.
- Surprisingly, Brisbane and Adelaide unit sellers are now enjoying the highest median resale profits, exceeding $250,000, even outpacing Sydney, where prices tend to be higher but gains smaller relative to cost.
- Regionally, unit sellers fared better than those in the combined capitals, with 95.7% of units selling profitably, compared to 85.6% in capital cities.
Capital cities: still a safe bet, but some standouts
Brisbane and Perth are the current golden children of the capital city markets, with more than 99% of houses selling at a profit.
Sydney remains rock solid too, delivering the highest median resale gain of all capitals at $700,500.
Table 1: Profit and loss outcomes for house resales
| Profit | Loss | |||||
| % sales | Median gain ($) | Median gain (YoY %) | % sales | Median loss ($) | Median loss (YoY %) | |
| Australia | 96.8% | $365,000 | 9.6% | 3.2% | -$55,000 | 0.0% |
| Combined capitals | 96.9% | $438,500 | 8.3% | 3.1% | -$62,000 | -4.6% |
| Combined regionals | 96.7% | $280,000 | 12.0% | 3.3% | -$46,500 | 3.3% |
| Sydney | 97.9% | $700,500 | 6.9% | 2.1% | -$110,000 | -13.4% |
| Melbourne | 94.8% | $376,000 | -3.1% | 5.2% | -$50,000 | 11.1% |
| Brisbane | 99.5% | $480,000 | 12.9% | 0.5% | -$150,000 | 150.0% |
| Adelaide | 97.3% | $430,000 | 19.6% | 2.7% | -$200,000 | 15.3% |
| Perth | 99.0% | $339,000 | 22.4% | 1.0% | -$62,000 | -4.6% |
| Canberra | 92.9% | $420,000 | 0.0% | 7.1% | -$79,000 | 21.5% |
| Hobart | 91.6% | $282,978 | 4.0% | 8.4% | -$50,000 | 0.0% |
| Darwin | 84.2% | $157,250 | -25.8% | 15.8% | -$34,000 | -43.3% |
That said, not all cities are firing equally.
Melbourne’s median house resale gain slipped slightly compared to last year, and Darwin is still struggling with weaker long-term growth, with median profits there at just $157,250.
On the unit front, Brisbane, Adelaide and Perth are outperforming spectacularly: over 97% of units in these cities sold for a gain, often with double-digit annual increases in median profit.
Table 2: Profit and loss outcomes unit resales
- Also read:March Home Prices Still Rising | Latest stats from Dr. Andrew Wilson

- Also read:Melbourne property market forecast for 2026 | Is it a good time to invest in Melbourne?

- Also read:Latest Property Price Forecasts Revealed. Australian Property Market Outlook 2026: Where To Now After The Rate Rise.

- Also read:Brisbane Property Market Forecast [2026] – What’s Ahead & Where to Invest

- Also read:Sydney property market forecast for 2026. Is it a good time to invest in Sydney?

| Profit | Loss | |||||
| % sales | Median gain ($) | Median gain (YoY %) | % sales | Median loss ($) | Median loss (YoY %) | |
| Australia | 87.8% | $202,000 | 15.4% | 12.2% | -$46,039 | 2.3% |
| Combined capitals | 85.6% | $195,000 | 18.1% | 14.4% | -$45,000 | 4.7% |
| Combined regionals | 95.7% | $225,000 | 12.5% | 4.3% | -$56,500 | -5.8% |
| Sydney | 87.6% | $190,000 | 0.0% | 12.4% | -$45,000 | 0.0% |
| Melbourne | 73.0% | $120,000 | -5.9% | 27.0% | -$45,000 | 7.1% |
| Brisbane | 99.0% | $255,000 | 40.4% | 1.0% | -$253,000 | 729.5% |
| Adelaide | 97.3% | $253,100 | 37.4% | 2.7% | -$197,500 | 295.0% |
| Perth | 97.8% | $180,000 | 55.5% | 2.2% | -$50,000 | 66.7% |
| Canberra | 89.9% | $130,000 | -10.1% | 10.1% | -$28,000 | -21.5% |
| Hobart | 88.9% | $201,000 | 0.5% | 11.1% | -$40,000 | -41.2% |
| Darwin | 53.4% | $55,000 | -31.3% | 46.6% | -$59,500 | -27.3% |
By contrast, Melbourne’s unit market is lagging badly, with only 73% of sales in the black.
Regional Australia: steady, strong, and predictable
Regional sellers continue to do well. Most areas are seeing more than 95% of houses resold for a profit.
Regional NSW and regional Queensland lead the pack for dollar gains, with lifestyle and sea-change destinations topping the list.
Regional units are also shining, often outperforming their capital city counterparts thanks to longer holding periods and strong demand in lifestyle hubs.
Where the big money’s being made
The largest resale gains are happening in premium city suburbs , think Sydney’s Eastern Suburbs-North ($2.46 million median profit) or Melbourne’s Boroondara ($1.19 million).
Table 3. Top city areas with the largest median profit – houses
| Rank | Sydney | Melbourne | Brisbane | Adelaide | Perth |
| 1 | Eastern Suburbs - North ($2,462,500) | Boroondara ($1,192,500) | Brisbane Inner - West ($1,029,085) | Burnside ($830,000) | Cottesloe - Claremont ($1,005,000) |
| 2 | Manly ($2,264,500) | Stonnington - East ($1,100,000) | Sherwood - Indooroopilly ($885,000) | Unley ($753,800) | Melville ($582,888) |
| 3 | Chatswood - Lane Cove ($1,950,000) | Bayside ($962,000) | Brisbane Inner - North ($857,000) | Holdfast Bay ($747,000) | Fremantle ($575,000) |
| 4 | North Sydney - Mosman ($1,945,000) | Stonnington - West ($900,000) | Carindale ($850,000) | Prospect - Walkerville ($719,950) | Joondalup ($491,790) |
| 5 | Ku-ring-gai ($1,927,000) | Manningham - East ($829,000) | Mt Gravatt ($797,500) | Mitcham ($692,500) | South Perth ($466,000) |
These are areas where even modest percentage growth translates into huge dollar gains because the entry price is already so high.
In regional markets, holiday and lifestyle areas like Surfers Paradise, Tweed Valley and the Surf Coast are delivering stellar returns, driven by high-income buyers, downsizers, and pandemic-era relocations.
Where the losses are
While losses are rare, when they happen, they tend to occur in the same high-end areas that make the biggest gains, the flipside of high-value property is that downturns hit harder in dollar terms.
In the regions, volatile lifestyle markets and mining areas see more loss-making sales, often tied to shifting demand or industry cycles.
What this means for you
The report reinforces what seasoned investors already know: property rewards patience.
Longer holding periods, strategic location choices, and a clear understanding of market cycles can deliver life-changing gains.
If you’re holding a well-located asset, you’re probably sitting on a significant equity buffer.
That’s not just a safety net, it’s an opportunity.
Used wisely, it can fund renovations, portfolio growth, or diversification into other asset classes.
And for buyers, this data is a reminder that even in a strong market, not all suburbs, or dwelling types, are created equal.
Units in some cities are still underperforming, and chasing “cheap” can end up costing more in the long run if capital growth isn’t there.
If you’ve owned your home or investment property for close to a decade, odds are you’re well ahead and if the market momentum continues as expected, 2025 could be another year where property proves why it’s still Australia’s favourite way to build wealth.


