

Key takeaways
National residential property listings rose 2.6% month-on-month in September to 276,839 dwellings.
Total listings are now 21.6% higher than September 2025, with most of the annual increase in stock listed between one and six months ago.
New listings jumped 8.7% nationally as the spring selling season got underway and are 8.1% higher year-on-year.
Old listings increased 2.3% nationally and are now 10.5% above September 2025 levels.
Distressed listings rose a further 8.0% to 4,872 properties and are now 29.2% higher year-on-year.
National combined asking prices eased 0.4% over the month while remaining 3.6% higher year-on-year.
SQM Research’s Weekly Asking Prices Index for the week ending 29 September 2026 showed a modest easing in asking prices nationally over the month, while annual growth remained positive.
Nationally, house asking prices eased 0.4% over the month, while unit asking prices declined 0.2%. Combined dwelling asking prices fell 0.4% month-on-month and remain 3.6% higher year-on-year.
Sydney combined asking prices increased 0.6% for the month but are 1.1% lower than a year ago, while Melbourne eased 0.6% for the month and remains 0.5% higher annually.
Brisbane recorded a 2.1% monthly decline in combined asking prices, the largest fall among the capitals, but remains 2.6% higher year-on-year. Perth also softened, down 1.1% for the month, while maintaining annual growth of 8.2%.
Adelaide combined asking prices eased 1.0% over the month and remain 4.0% higher year-on-year.
Canberra was broadly steady (+0.1%) over the month, with combined asking prices now 0.7% below a year ago.
Darwin’s combined asking prices rose 1.2% over the month and are 10.1% higher year-on-year, the strongest annual growth of any capital. Hobart recorded a 1.1% monthly increase and is 8.8% higher annually.

Australia’s residential property market recorded a renewed build-up in available stock during September, with total listings rising 2.6% to 276,839 dwellings as the spring selling season commenced.
National stock is now 21.6% higher than a year ago, giving buyers considerably more choice than at the same time in 2025.
Sydney listings rose 2.0% to 39,068 and are now 19.3% higher year-on-year.
Melbourne increased 1.8% to 49,341 and continues to hold the largest volume of stock of any capital, with listings 30.3% higher annually.
Brisbane listings rose 3.8% to 21,153. Stock in Brisbane is now 43.5% above September 2025, the strongest annual increase of any capital city, with stock listed for between one and six months almost doubling over the year.
Perth recorded the largest monthly rise among the capitals (+4.5%) and is now 21.3% higher year-on-year.
Adelaide increased 4.2% and is 39.5% higher annually, while Canberra rose 1.7% and remains 17.8% above last year.
Darwin was the only capital to record a monthly decline, easing 3.1%, although listings remain 11.6% higher year-on-year.
Hobart rose 2.5% for the month but remains the only capital with lower total stock than a year ago, down 3.1%.
Total Listings of Properties for Sale
| City | Sep 2026 Total | Aug 2026 Total | Sep 2025 Total | Monthly change | Yearly Change % |
|---|---|---|---|---|---|
| Sydney | 39,068 | 38,923 | 32,759 | 2.0% | 19.3% |
| Melbourne | 49,341 | 48,475 | 37,867 | 1.8% | 30.3% |
| Brisbane | 21,153 | 20,374 | 14,475 | 3.8% | 43.5% |
| Perth | 15,825 | 15,146 | 13,049 | 4.5% | 21.3% |
| Adelaide | 10,849 | 10,407 | 7,777 | 4.2% | 39.5% |
| Canberra | 5,066 | 4,983 | 4,302 | 1.7% | 17.8% |
| Darwin | 1,041 | 1,074 | 933 | -3.1% | 11.6% |
| Hobart | 2,474 | 2,414 | 2,554 | 2.5% | -3.1% |
| National | 276,839 | 269,717 | 227,671 | 2.6% | 21.6% |
Source: SQM Research
New Listings
New listings increased 8.7% nationally in September to 80,496 dwellings, with fresh stock 8.1% higher than a year ago.
Sydney recorded a 10.2% monthly increase, although new listings remain 9.4% below September 2025. Despite fewer vendors coming to market, total Sydney stock is 19.3% higher than a year ago, pointing to slower absorption rather than additional supply.
Melbourne rose 5.1% and sits 7.9% higher year-on-year.
Brisbane (+4.5%), Perth (+1.9%) and Adelaide (+3.7%) all recorded monthly increases, with Adelaide’s new listings now 22.7% higher than a year ago. Canberra recorded a strong 11.7% monthly rise but remains 6.2% below last year.
Hobart recorded the largest monthly increase, up 15.5%, while Darwin was the only capital to record a fall, down 5.8%. On an annual basis, Darwin is 18.4% higher and Hobart 4.9% higher.
The broad-based lift in fresh stock is consistent with the usual seasonal pattern, as vendors return to the market for spring.
New Listings of properties for sale (less than 30 days)
| City | Sep 2026 Total | Aug 2026 Total | Sep 2025 Total | Monthly change | Yearly Change % |
|---|---|---|---|---|---|
| Sydney | 14,878 | 13,499 | 16,422 | 10.2% | -9.4% |
| Melbourne | 19,303 | 18,370 | 17,886 | 5.1% | 7.9% |
| Brisbane | 7,365 | 7,048 | 6,969 | 4.5% | 5.7% |
| Perth | 6,022 | 5,910 | 5,541 | 1.9% | 8.7% |
| Adelaide | 4,711 | 4,544 | 3,841 | 3.7% | 22.7% |
| Canberra | 1,975 | 1,768 | 2,106 | 11.7% | -6.2% |
| Darwin | 277 | 294 | 234 | -5.8% | 18.4% |
| Hobart | 619 | 536 | 590 | 15.5% | 4.9% |
| National | 80,496 | 74,049 | 74,464 | 8.7% | 8.1% |
Source: SQM Research
Old Listings
Older listings increased 2.3% nationally in September to 79,134 dwellings and are now 10.5% higher than a year ago.
Sydney (+6.3%), Melbourne (+6.4%) and Brisbane (+16.0%) all recorded further increases in older stock. Sydney’s old listings are now 28.3% higher year-on-year, while Melbourne is 29.6% higher and Brisbane 26.8% higher.
Perth recorded a 10.9% monthly increase, although old listings remain 8.7% below September 2025 levels.
Adelaide (+2.7%), Canberra (+6.0%) and Hobart (+6.7%) also recorded monthly increases, while Darwin’s aged stock rose 22.7% from a low base. All four markets remain below last year, with Darwin down 27.7%, Hobart down 10.4%, Adelaide down 8.0% and Canberra down 5.6%.
The continued accumulation of aged stock in Sydney, Melbourne and Brisbane suggests longer selling times remain concentrated in these markets rather than spread across the country.
| City | Sep-2026 | Aug 2026 | Sep 2025 | Monthly % change | Yearly Change % |
|---|---|---|---|---|---|
| Sydney | 7,689 | 7,236 | 5,993 | 6.3% | 28.3% |
| Melbourne | 10,518 | 9,885 | 8,114 | 6.4% | 29.6% |
| Brisbane | 2,118 | 1,887 | 1,726 | 16.0% | 26.8% |
| Perth | 1,421 | 1,281 | 1,557 | 10.9% | -8.7% |
| Adelaide | 1,098 | 1,069 | 1,194 | 2.7% | -8.0% |
| Canberra | 794 | 749 | 841 | 6.0% | -5.6% |
| Darwin | 222 | 181 | 307 | 22.7% | -27.7% |
| Hobart | 1,025 | 961 | 1,144 | 6.7% | -10.4% |
| National | 79,134 | 77,355 | 71,619 | 2.3% | 10.5% |
Source: SQM Research
Distressed Listings
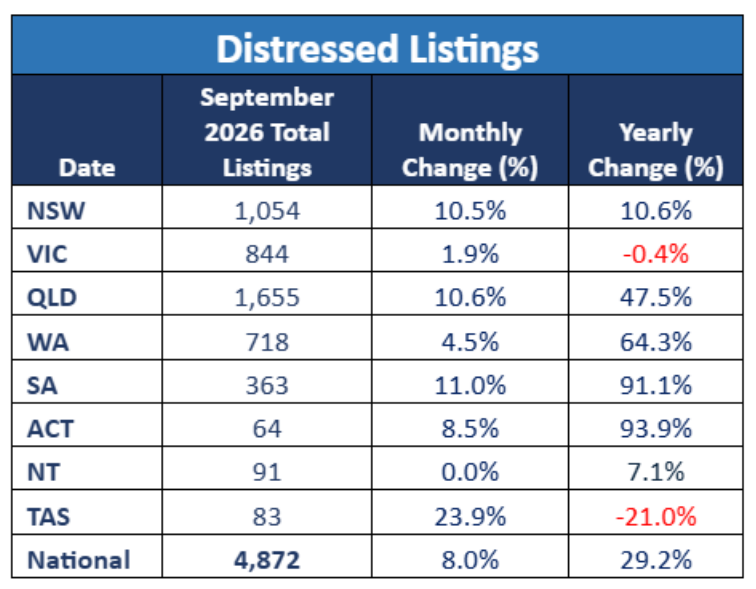
Distressed property listings increased 8.0% nationally during September to 4,872 properties. Distressed listings are now 29.2% higher than September 2025.
Queensland recorded a 10.6% monthly increase to 1,655 distressed listings and is now 47.5% higher year-on-year. Western Australia increased 4.5% for the month and is 64.3% higher annually.
South Australia rose 11.0% month-on-month and is 91.1% higher year-on-year, while the ACT rose 8.5% and is 93.9% above September 2025, albeit from a small base.
New South Wales recorded a 10.5% monthly rise to 1,054 listings and is now 10.6% higher year-on-year. Victoria rose 1.9% and is broadly in line with last year (-0.4%). Tasmania increased 23.9% for the month but remains 21.0% lower year-on-year, while the Northern Territory was unchanged over the month and is 7.1% higher year-on-year.
The national increase does not in itself indicate widespread mortgage distress, but the continued rise – now evident across most states – warrants close monitoring.
Distressed Property Listings
Source: SQM Research
Asking Prices
Sydney Weekly Asking Prices Index
| Property type | Price ($) | Weekly Change | Monthly Change % | Annual % change |
|---|---|---|---|---|
| All Houses | 2,065.591 | -11.312 | 1.0% | -1.6% |
| All Units | 891.054 | 3.046 | -0.7% | 1.4% |
| Combined | 1,585.028 | -5.437 | 0.6% | -1.1% |
Source: SQM Research
Melbourne Weekly Asking Prices Index
| Property type | Price ($) | Weekly Change | Monthly Change % | Annual % change |
|---|---|---|---|---|
| All Houses | 1,294.661 | -2.261 | -0.8% | -0.6% |
| All Units | 680.687 | 0.813 | 0.3% | 5.1% |
| Combined | 1,100.716 | -1.290 | -0.6% | 0.5% |
Source: SQM Research
Perth Weekly Asking Prices Index
| Property type | Price ($) | Weekly Change | Monthly Change % | Annual % change |
|---|---|---|---|---|
| All Houses | 1,243.914 | 7.685 | -0.9% | 7.3% |
| All Units | 767.136 | -1.648 | -1.6% | 12.9% |
| Combined | 1,118.406 | 5.228 | -1.1% | 8.2% |
Source: SQM Research
Brisbane Weekly Asking Prices Index
| Property type | Price ($) | Weekly Change | Monthly Change % | Annual % change |
|---|---|---|---|---|
| All Houses | 1,330.979 | -3.791 | -2.1% | 2.1% |
| All Units | 826.442 | -4.042 | -1.7% | 5.7% |
| Combined | 1,206.829 | -3.855 | -2.1% | 2.6% |
Source: SQM Research.
Adelaide Weekly Asking Prices Index
| Property type | Price ($) | Weekly Change | Monthly Change % | Annual % change |
|---|---|---|---|---|
| All Houses | 1,104.829 | 0.071 | -1.2% | 3.4% |
| All Units | 634.841 | -2.741 | 0.4% | 9.1% |
| Combined | 1,019.918 | -0.437 | -1.0% | 4.0% |
Source: SQM Research
Canberra Weekly Asking Prices Index
| Property type | Price ($) | Weekly Change | Monthly Change % | Annual % change |
|---|---|---|---|---|
| All Houses | 1,228.864 | 0.361 | 0.3% | -1.2% |
| All Units | 603.404 | -0.154 | -0.4% | 3.4% |
| Combined | 989.692 | 0.164 | 0.1% | -0.7% |
Source: SQM Research
Darwin Weekly Asking Prices Index
| Property type | Price ($) | Weekly Change | Monthly Change % | Annual % change |
|---|---|---|---|---|
| All Houses | 844.723 | 9.277 | 0.1% | -0.7% |
| All Units | 507.900 | 15.850 | 4.2% | 16.1% |
| Combined | 712.268 | 11.862 | 1.2% | 10.1% |
Source: SQM Research
Hobart Weekly Asking Prices Index
| Property type | Price ($) | Weekly Change | Monthly Change % | Annual % change |
|---|---|---|---|---|
| All Houses | 925.728 | 1.472 | 1.5% | 9.0% |
| All Units | 523.652 | -3.452 | -2.2% | 7.4% |
| Combined | 864.013 | 0.716 | 1.1% | 8.8% |
Source: SQM Research
National Weekly Asking Prices Index
| Property type | Price ($) | Weekly Change | Monthly Change % | Annual % change |
|---|---|---|---|---|
| All Houses | 1,059.946 | -4.285 | -0.4% | 3.0% |
| All Units | 655.821 | 1.241 | -0.2% | 7.8% |
| Combined | 971.994 | -3.079 | -0.4% | 3.6% |
Source: SQM Research
Capital City Average Weekly Asking Prices Index
| Property type | Price ($) | Weekly Change | Monthly Change % | Annual % change |
|---|---|---|---|---|
| All Houses | 1,511.923 | -6.729 | -0.3% | 0.0% |
| All Units | 792.155 | 3.576 | -0.4% | 4.0% |
| Combined | 1,295.712 | -3.633 | -0.4% | 0.6% |
Source: SQM Research
Final note...
Spring has brought the usual lift in new listings, but that’s not what’s behind the 20 per cent annual rise in stock.
The bulk of the increase is property that has been on the market for one to six months and hasn’t sold.
In Sydney, fewer vendors are listing than a year ago, yet total stock is up almost a fifth. That’s a demand problem, not a supply surge.
Brisbane and Adelaide stand out, with total listings up 43.5 per cent and 39.5 per cent respectively over the year, while Melbourne is carrying 30 per cent more stock than this time last year.
Buyers in these markets have significantly more choice and, in turn, more negotiating power.
Distressed listings remain the key indicator we are watching. National distressed stock is now almost 30 per cent higher than a year ago, with South Australia and the ACT close to doubling and Western Australia and Queensland also recording large annual increases.
In absolute terms the numbers remain relatively contained, but the trend is clearly upward.
With stock building and national asking prices easing over the month, led by Brisbane, Perth and Adelaide, conditions are shifting in favour of buyers.
How vendors respond over the remainder of spring will be an important signal for the market heading into 2027.
- Also read:National Weekly Auction Report – October 24th 2026 | More Underwhelming Home Auction Results Over Past Week

- Also read:This week’s Australian Property Market Update – Latest Data, State by State October 20th 2026

- Also read:Latest Property Price Forecasts. Australian Property Market Outlook 2026-2027: Navigating a Market Correction

- Also read:Everything you need to know about the state of Australia’s property markets in 20 charts – October2026

- Also read:Adelaide housing market update [video] | October 2026