


Key takeaways
Australia’s capital city property markets regularly move out of alignment as individual cities pass through different stages of the property cycle.
Charter Keck Cramer identified 46 significant relative-value dislocations across Sydney, Melbourne, Brisbane, Perth and Adelaide over the past 40 years.
Of those dislocations, 39 have already recalibrated, representing 85% of all episodes, with a median recovery time of 18 months.
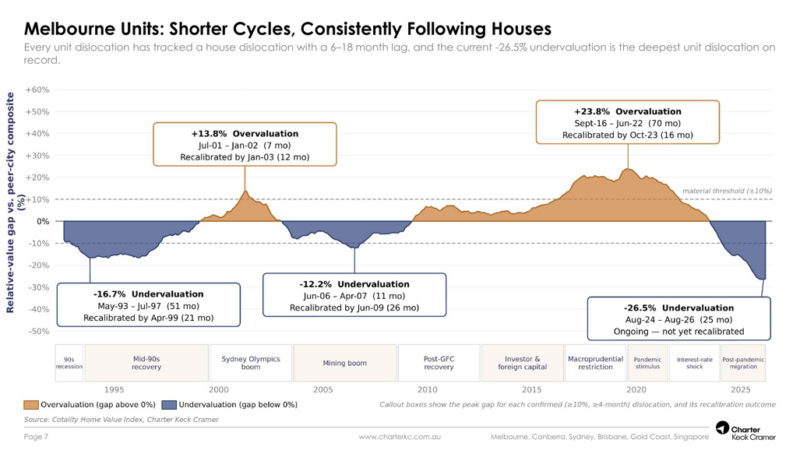
Melbourne units are currently 26.5% below their long-term relative-value norm, while Melbourne houses are undervalued by 17.1%.
Sydney units have shifted from a prolonged overvaluation into a fresh 15.8% relative undervaluation.
Brisbane houses are now 11.2% above their historical relative-value norm, following several years of strong price growth.
Perth has recently completed the deepest boom-bust cycle of any capital city in the study and has returned closer to equilibrium.
Adelaide units are the major outlier, sitting at a record 35.5% relative overvaluation, with the gap still widening.
Recalibration does not necessarily require property prices to fall. The gap may close through slower growth in one city while other capitals catch up.
Relative value can help investors identify changing opportunities, although property selection, local economic fundamentals and long-term owner-occupier demand remain more important than citywide averages.
Australia’s capital city property markets rarely move together for long.
One city surges ahead, another loses momentum and the price gaps that once looked permanent eventually begin to close.
We have seen this pattern repeatedly, although every cycle arrives with a fresh explanation for why this time may be different.
Melbourne is currently trading at a substantial relative discount, Brisbane and Adelaide have enjoyed strong runs, Sydney has shifted in a different direction across houses and units, while Perth has only recently completed one of the most dramatic boom-bust cycles in the country.
This raises an important question for property investors: are today’s price gaps a normal part of the cycle, or evidence that some capital city markets have moved into genuinely unfamiliar territory?
Charter Keck Cramer has examined 40 years of capital city data to answer that question. Its analysis identified 46 material relative-value dislocations (I’ll explain this below) across the house and unit markets in Sydney, Melbourne, Brisbane, Perth and Adelaide.
Of those 46 episodes, 39 have already fully recalibrated.
That is an 85% historical recalibration rate, with completed episodes taking a median of 18 months to return to their long-term relative-value norm.

What does a property market dislocation mean?
The report does not describe a city as cheap or expensive simply because its median price is high or low.
Instead, Charter Keck Cramer compares each city with a basket made up of the other four capitals and measures how far that relationship has moved from its long-term norm.
A material dislocation occurs when the relative-value gap remains more than 10% above or below that norm for at least four consecutive months. Recalibration occurs when the gap returns to within 2.5% of the norm, or when a new confirmed dislocation overtakes the previous episode.
That distinction matters because relative value is different from absolute affordability.

Note: Sydney can remain Australia’s most expensive capital city and still become relatively undervalued if prices elsewhere rise more quickly, while a cheaper city can become relatively overvalued after an unusually strong period of growth.
It also means recalibration doesn’t require prices in an overvalued market to crash. The gap can close through slower growth, a period of flat prices, stronger growth in other cities, or some combination of all three.
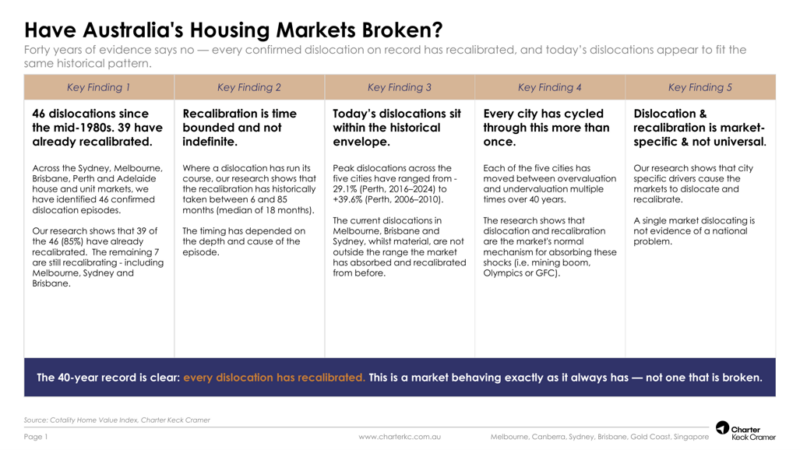
Charter Keck Cramer’s five key findings from 40 years of relative-value analysis.
Forty years of evidence points to mean reversion
The research covers 11 very different housing regimes, beginning with financial deregulation and the asset boom of the late 1980s and extending through the early 1990s recession, the Sydney Olympics, the mining boom, the global financial crisis, macroprudential lending restrictions, the pandemic and the recent migration-led recovery.
Across those changing economic conditions, every completed dislocation eventually recalibrated.
Completed episodes lasted anywhere from six to 85 months, which tells us that mean reversion has been persistent, but its timing has been highly variable.
The cause and depth of each episode mattered. Credit conditions, population flows, major infrastructure programs, investor lending, foreign capital, mining investment and supply constraints have all pushed individual markets away from their usual relationship with the other capitals.
This supports a point I have made for many years: there is no single Australian property market. Each capital city has its own economic base, demographic pressures, housing mix and stage of the property cycle.
Sydney has moved from strength to relative weakness
Sydney houses experienced three successive periods of relative overvaluation between 2016 and 2024, with the gap peaking at 26.4% in 2021. That long adjustment finally recalibrated in November 2025.
Sydney units tell a more striking story. A seven-and-a-half-year period of overvaluation, which peaked at 30.1%, recalibrated by the middle of 2024. A fresh relative undervaluation had opened by August 2026, reaching 15.8% below the long-run norm.
That does not automatically make every Sydney apartment a good investment. Quality, scarcity, owner-occupier appeal, building condition and location remain critical, particularly in a city with large pockets of generic high-density stock.
However, the change in relative value is significant because Sydney’s long-term demand drivers have not disappeared. When affordability improves relative to other capitals, buyer attention and capital flows can eventually respond.
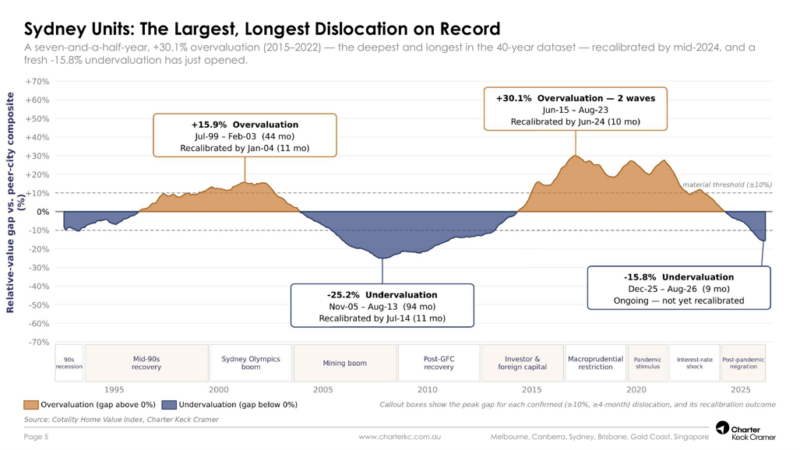
Sydney units moved from a prolonged overvaluation into a fresh 15.8% relative undervaluation.
Source: Cotality Home Value Index and Charter Keck Cramer.
Melbourne’s discount has become unusually deep
Melbourne provides perhaps the clearest example of how far sentiment and relative value can move.
Melbourne houses recorded an eight-and-a-half-year period of overvaluation from 2015 to 2023, peaking at 38.1%.
That episode has now fully unwound, and a fresh undervaluation emerged in late 2025, reaching 17.1% by August 2026.
The unit market has moved further. By August 2026, Melbourne units were 26.5% below their long-run relative-value norm, the deepest unit dislocation recorded for the city in the 40-year dataset.
This fits with my view that Melbourne currently offers some of Australia’s best long-term buying opportunities, although investors still need to be highly selective. Victoria’s higher taxes, regulatory changes and weaker investor sentiment explain part of the discount, and those headwinds should not be dismissed.
At the same time, Melbourne continues to benefit from population growth, a large and diverse economy, world-class education and established inner and middle-ring suburbs with deep owner-occupier demand. In my opinion, well-located investment-grade properties in those areas are more compelling than the citywide figures suggest.
- Also read:This week’s Australian Property Market Update – Latest Data, State by State October 20th 2026

- Also read:Latest Property Price Forecasts. Australian Property Market Outlook 2026-2027: Navigating a Market Correction

- Also read:Brisbane Property Market Forecast [2026 & Beyond] – What The Olympics Decade Means for Investors.

- Also read:Melbourne property market forecast for 2026 & 2027 | Separating the fundamentals from the sentiment

- Also read:Sydney property market forecast for 2026 and 2027 | Why the short-term softness is a long-term opportunity

Melbourne units reached a record 26.5% relative undervaluation by August 2026.
Source: Cotality Home Value Index and Charter Keck Cramer.
Brisbane has crossed into overvaluation
Brisbane houses have historically recorded relatively few overvaluation episodes.
The report identifies only two before the current cycle, peaking at 18.1% in the mid-1990s and 11.4% during the early stages of the resources boom.
A new house overvaluation began in May 2026 and reached 11.2% by August. Brisbane units, meanwhile, completed an extraordinary 137-month undervaluation in early 2025, the longest dislocation for any city and property type in the study.
Brisbane still has strong population, infrastructure and lifestyle tailwinds, and selected properties should continue to perform well over the long term. Yet the easy relative-value argument has weakened after years of strong growth, making asset selection and the price paid increasingly important.
Perth has completed an extreme cycle
Perth demonstrates how violently a market can move in both directions while still returning towards its long-run relationship with other capitals.
During the mining boom, Perth houses reached a record 39.6% relative overvaluation in 2006. A decade later, the market had moved into an eight-year undervaluation that bottomed at 29.1% below its norm and did not recalibrate until December 2025.
Perth units followed an almost identical path, moving from a 39.2% overvaluation during the mining boom to a 26.7% undervaluation between 2016 and 2024, before recalibrating in November 2025.
Perth’s recent performance has been supported by affordability, tight supply, strong migration and a robust state economy. The longer history is a useful reminder that resource-driven markets can experience larger cycles than their short-term momentum suggests.
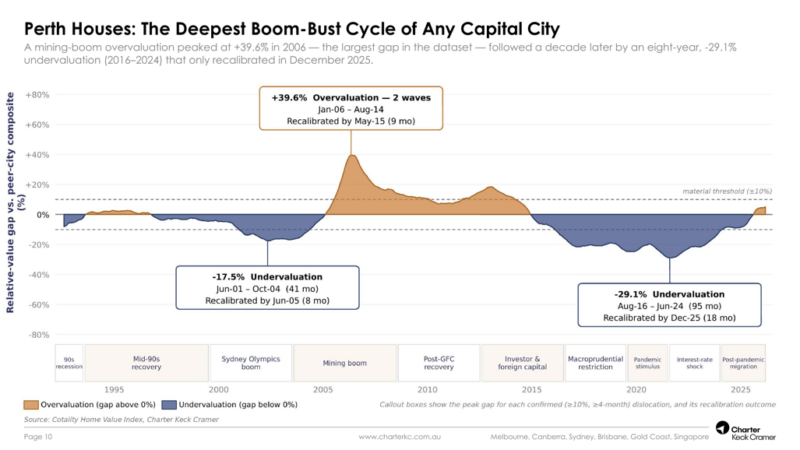
Perth houses completed the deepest boom-bust cycle of any capital city in the dataset.
Source: Cotality Home Value Index and Charter Keck Cramer.
Adelaide units are the genuine outlier
Adelaide houses have never recorded a confirmed relative overvaluation under the report’s methodology. Its previous house dislocations were shallow undervaluations, all of which had recalibrated by the 2022 boom.
Adelaide units are a very different story. They have remained overvalued since 2022 and were 35.5% above their long-run relative-value norm by August 2026. This is the largest and longest-running overvaluation in Adelaide’s unit-market history, and the gap was still widening when the report was prepared.
This does not mean Adelaide unit prices must fall sharply. Recalibration could occur through a prolonged period of slower growth while other cities catch up, and structural changes may also have shifted the market’s usual relationship with its peers.
Nevertheless, the scale of the gap deserves attention. Investors who assume the strongest recent performer must remain the strongest future performer may be extrapolating yesterday’s growth into tomorrow.
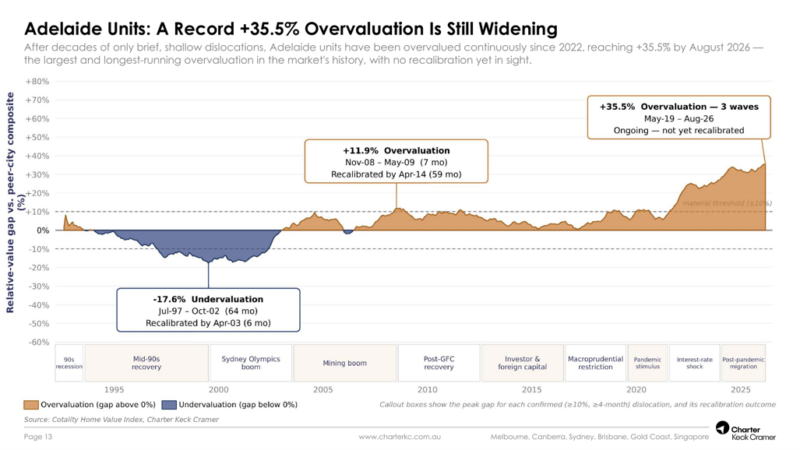
Adelaide units were 35.5% above their long-run relative-value norm in August 2026 and the gap was still widening. Source: Cotality Home Value Index and Charter Keck Cramer.
What this means for property investors
The report gives investors a useful long-term framework, although it shouldn’t be treated as a short-term forecasting tool.
An 85% historical recalibration rate says a great deal about market behaviour, while the six-to-85-month range says very little about exactly when the next adjustment will occur.
Relative undervaluation can create opportunity when the market’s long-term fundamentals remain sound.
It can also reflect genuine structural problems, so investors need to understand why a city has fallen behind and whether those conditions are likely to persist.
Relative overvaluation is equally nuanced. It can be sustained for some time by population growth, tight listings and undersupply, but the higher the premium, the more future performance depends on those favourable conditions continuing.
My preference remains to invest where several forces align: strong and diverse local economies, above-average household incomes, limited supply, established infrastructure, and a deep pool of owner-occupiers who can afford to pay more for the right property over time.
The figures also reinforce the value of diversifying across markets and buying at different stages of the cycle. Investors who chase the city that has just delivered the strongest growth are often buying after much of the relative-value advantage has already disappeared.
Note: Today’s dislocations don’t suggest Australia’s housing markets are broken.
They show that our capitals are moving through different stages of a familiar process, with Melbourne and parts of Sydney offering improving relative value, Brisbane having moved ahead, Perth completing an unusually deep cycle and Adelaide units sitting well outside their historical comfort zone.
History suggests most of these gaps will eventually close. The investors most likely to benefit will be those who look beyond recent price growth, understand the reasons behind the dislocation and choose investment-grade assets with the fundamentals to perform through the next stage of the cycle.
The bottom line
History suggests the price gaps between our capital cities will eventually narrow, although the process rarely unfolds evenly or according to a predictable timetable.
For investors, this creates opportunities, but relative value alone is never enough reason to buy. A market can appear inexpensive for good reasons, while an apparently expensive market may remain strong because of population growth, limited supply and rising household incomes.
Successful property investment still depends on buying the right property in the right location and ensuring it fits into a broader, evidence-based investment strategy. That means considering your finances, risk profile, cash flow and long-term goals before deciding where to invest.
At Metropole, we look beyond the headlines and citywide averages to identify investment-grade properties with the location, scarcity and owner-occupier appeal required to outperform over the long term.
If you would like to understand how these changing relative-value gaps could affect your investment decisions, why not have a Wealth Discovery Chat with one of Metropole’s Wealth Strategists? We can help you build a personalised Strategic Property Plan designed to safely grow, protect and pass on your wealth.
You can find out more and book your Wealth Discovery Session here: