


Key takeaways
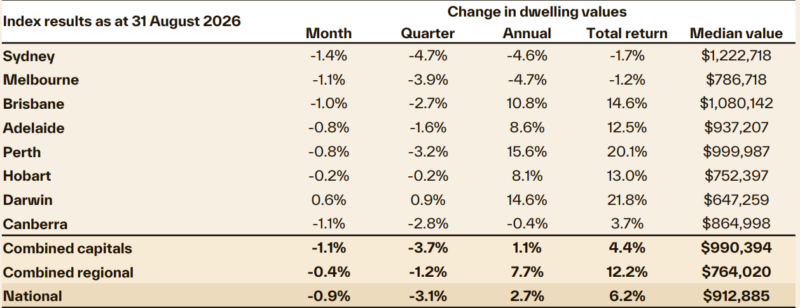
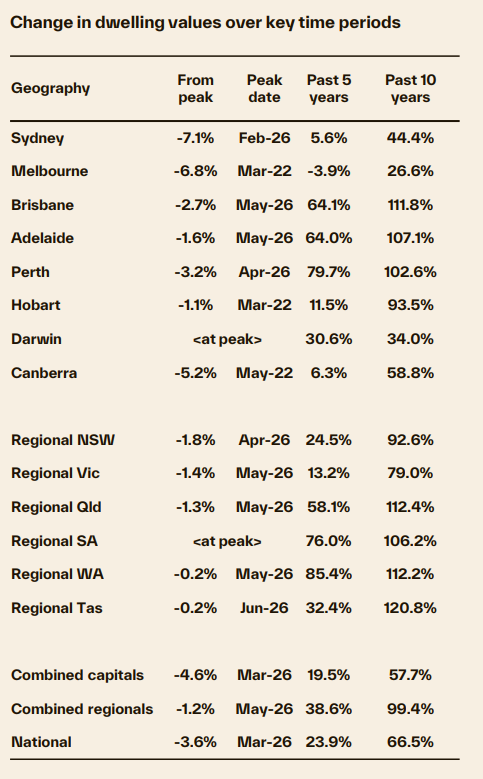
Cotality's national Home Value Index fell 0.9% in August, marking a fifth consecutive month of decline and taking national home values 3.6% below the market peak recorded in March.
The downturn is becoming more widespread, with 93% of capital city suburbs recording a value decline through winter.
Sydney leads the downturn with values down 1.4% in August (7.1% below peak), outpacing its earlier 2022-23 correction due to falling demand and higher stock levels.
Quarterly sales tracked 15.5% lower than last year, driving total advertised capital city listings 24% higher than a year ago as homes take longer to sell.
Longer selling times and low auction clearance rates signal a buyer's market, though buyers currently lack the confidence to transact.
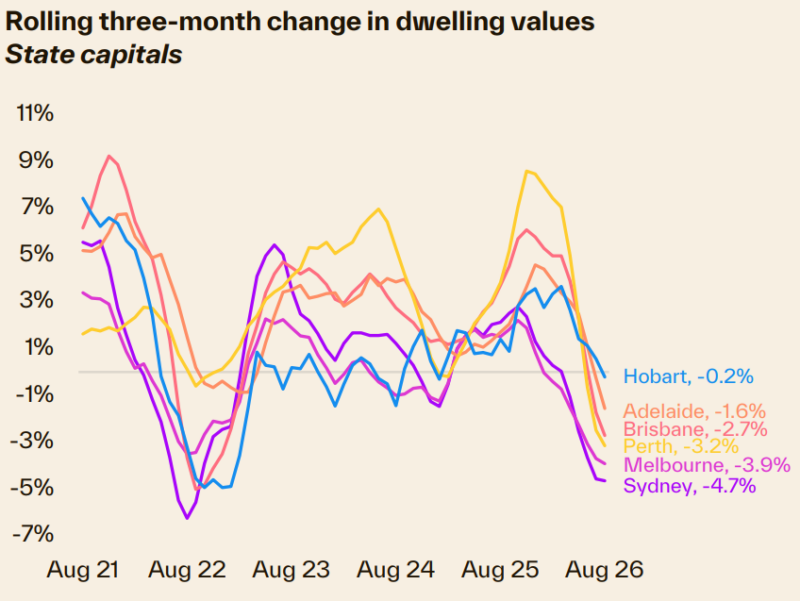
Home value declines spread sharply across Australia's housing market through winter, with home values falling across 93% of capital city suburbs and every capital city except Darwin recording a decline over the past three months.
Cotality's national Home Value Index fell 0.9% in August, marking a fifth consecutive month of decline and taking national home values 3.6% below the market peak recorded in March.
The latest figures show the downturn is no longer confined to select markets or higher-value segments.
What started as a more concentrated easing across higher-value segments has now become a much more generalised softening, with the vast majority of capital city suburbs recording some level of decline.
The proportion of capital city suburbs recording a fall in home values more than doubled through winter, rising from 45.8% in autumn to 93%, highlighting a much broader weakening in housing conditions.
Sydney continues to lead the pace of declines
Home values are down 1.4% in August, and 7.1% below peak levels recorded in February.
The rate of decline in Sydney home values is now outpacing the earlier 2022-23 correction, when home values were down 6.6% over the equivalent period following the market peak.
The combination of a sharp drop in demand and higher than average advertised stock levels is weighing more heavily on Australia’s largest housing market.
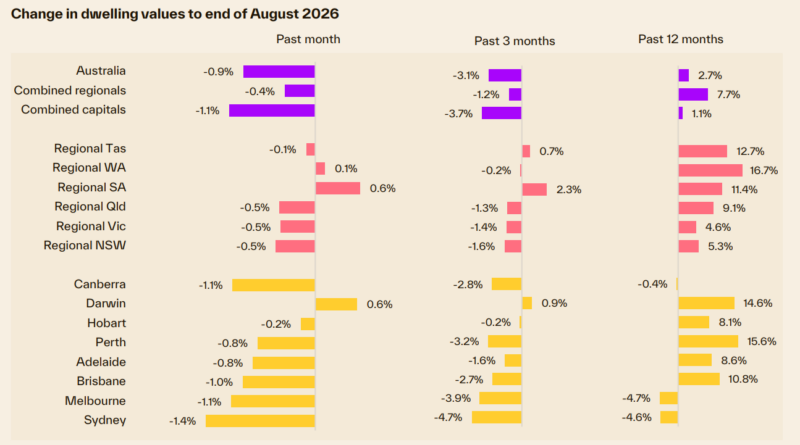
Melbourne, Canberra (both -1.1%) and Brisbane (-1.0%) are the only other capitals to record a decline of one per cent or more in home values over the month.
Still, the other mid-sized capitals aren't far behind, with Adelaide and Perth home values dropping 0.8% in August.
Most capitals are still seeing the more expensive end of the market record weaker conditions than lower-priced housing;
however, the performance gap has narrowed as the downturn has become more broad-based.
Higher-value housing continues to record larger declines amid elevated borrowing costs and serviceability constraints, while lower quartile values are now also falling as affordability pressures and weaker demand become more widespread.
The narrowing performance gap between the upper and lower quartiles is another sign this downturn is broadening.
Premium markets are still generally recording weaker conditions, but lower-priced housing is becoming less insulated as
affordability pressures and softer demand weigh more evenly across the market.
The combined regional index was down
The combined regional index was down 0.4% in August, taking regional values 1.2% lower through winter.
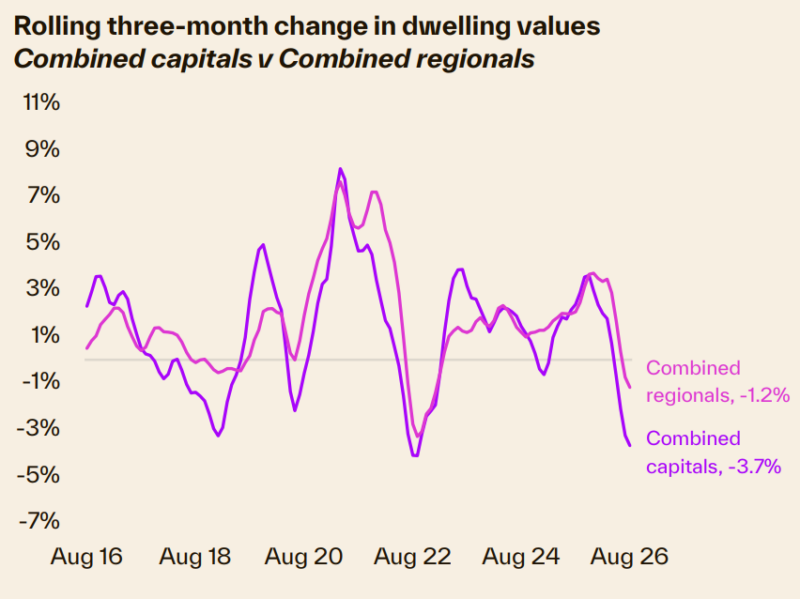
Regional South Australia was the only broad rest-of-state market to avoid a decline in values over the past three months, highlighting a deteriorating trend across regional Australia.
This weaker phase of the housing downturn has been largely driven by declining demand, with Cotality's quarterly estimate of home sales tracking 15.5% lower than at the same time last year and 11.5% below the five-year average.
Brisbane, Perth, and Sydney have recorded the largest declines in transaction activity, with estimated sales volumes down more than 20% compared with a year ago.
The softer trend in values is underpinned by weaker transaction activity.
Sales volumes are tracking well below both year-ago levels and the five-year average, which points to a clear reduction in buyer demand.
As demand has weakened, homes are taking longer to sell andlistings have accumulated
Across most capital cities, advertised supply is now tracking well above both year-ago and five-year average levels.
Over the four weeks ending August 30, capital city listings were 24% higher than a year ago and 8% above the fiveyear average.
This rise in listings comes despite fewer new listings, with the flow of freshly advertised homes added to the market tracking 6% lower than a year ago and 8% below the five-year average.
Higher advertised stock levels are simply a factor of a slower rate of absorption.
- Also read:Melbourne housing market update | October 2026

- Also read:National Vacancy Rate Rises to 1.4% | SQM Research

- Also read:Australian housing market update | October 2026

- Also read:This week’s Australian Property Market Update – Latest Data, State by State October 13th 2026

- Also read:Latest Property Price Forecasts. Australian Property Market Outlook 2026-2027: Navigating a Market Correction

Longer selling times, larger vendor discounting and persistently low auction clearance rates all point to a buyer's market, yet buyers are lacking the confidence to transact at the moment.
Outlook
1. Demand-side headwinds that have been building since late last year look to be becoming more entrenched as the market moves into spring.
Although lower housing values have improved purchasing affordability at the margin, affordability and serviceability constraints remain acute, with high mortgage rates, reduced borrowing capacity and cost-of-living pressures continuing to weigh on buyer demand.
2. The latest inflation data has added a further layer of downside risk.
With core inflation coming in higher than expected, a growing number of economists now expect the RBA could lift the cash rate again in September or November.
A further increase would be challenging against a backdrop of elevated household debt, much of which is housing-related, reducing borrowing capacity further, adding to repayment pressures for existing mortgage holders and placing additional pressure on consumer confidence.
The risk profile for housing has shifted more firmly to the downside.
Even though values have already moved lower, the combination of sticky inflation, the prospect of higher rates and ongoing pressure on household budgets suggests demand is likely to remain subdued through spring.
3. Consumer sentiment has improved from the lows recorded earlier in the year but remains deeply pessimistic.
Further gains are likely to be difficult while inflation remains elevated, and interest rates are expected to stay higher for longer.
After adjusting for inflation, wages have declined over four consecutive quarters, adding to the squeeze on household finances and making it harder for prospective buyers to save a deposit.
Ongoing geopolitical uncertainty also remains a risk to inflation and confidence, potentially causing households to delay major financial decisions such as purchasing a home.
The labour market remains an important source of support, although conditions are gradually loosening.
Low unemployment should help limit the risk of widespread arrears or distressed selling, but a softer labour market is likely to weigh further on housing demand.
Population growth has also normalised after the post-pandemic surge, removing some of the demand-side support that helped underpin housing conditions over recent years.
4. Weaker demand is becoming increasingly visible in selling conditions. Homes are taking longer to sell, auction clearance rates have held below the 50% mark, and advertised stock levels are above average across most capital city markets
With listings accumulating, buyers generally have more choice, less urgency and greater scope to negotiate.
The shift in selling conditions means buyers are generally facing less competition, while vendors are having to be more realistic on price as stock levels rise and days on market extend.
5. Spring normally brings a seasonal lift in the flow of homes coming onto the market, but the increase in new listings is unlikely to be as strong as usual this year.
Challenging selling conditions and the prospect of further falls in value are likely to discourage some prospective vendors from testing the market.
This supply-side response may become more apparent if selling times continue to lengthen and vendors become less confident of achieving their price expectations.
6. There are still factors helping to contain the downturn.
New housing supply remains insufficient relative to underlying demand, with elevated construction costs, capacity constraints and feasibility challenges limiting the prospect of a material lift in completions.
Incentives for first home buyers, including the 5% deposit scheme, should also support activity across the more affordable end of the market.
Overall, the housing market is likely to remain under downward pressure over the coming months.
The possibility of another rate rise, negative real wage growth, deeply pessimistic sentiment, a gradually loosening labour market and normalised population growth all point to softer demand.
However, persistently low levels of new housing supply, a still relatively low unemployment rate and targeted support for first home buyers should help limit the magnitude of value declines, reducing the risk of a more significant correction.