


Key takeaways
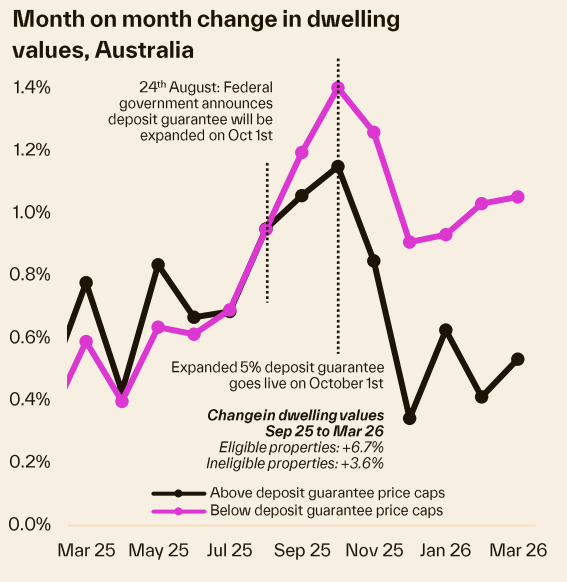
Since October, properties with an estimated value below the 5% deposit guarantee caps grew 6.7% compared to 3.6% for higher-priced homes.
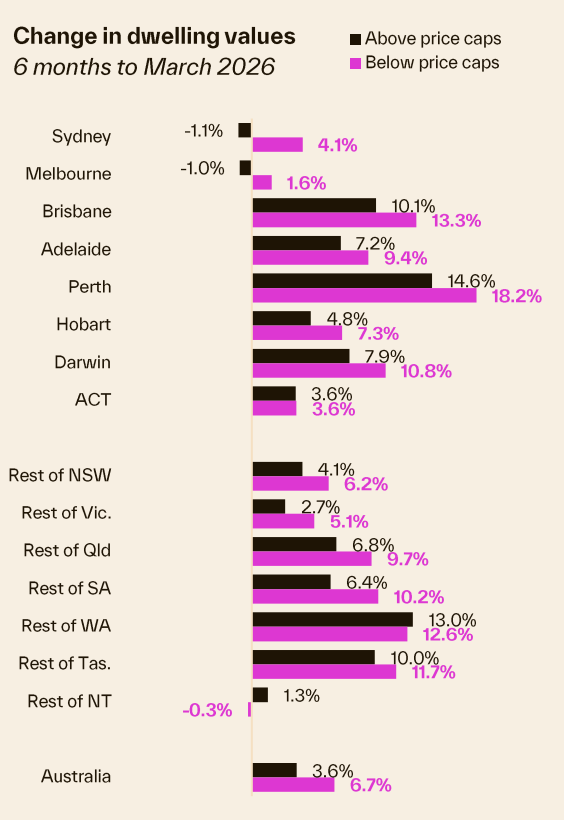
The trend is consistent across all capitals except Regional WA & NT, with Sydney recording the largest differential.
The portion of suburbs with a median value below the price caps fell to 11.6% in March, with Darwin recording the smallest portion of suburbs with a median value below the cap (10.3%)
Buyers are facing significant hurdles as interest rate rises and serviceability buffers require demonstrating an ability to service mortgages at 9% or higher.
Our housing markets are fragmenting.
New analysis from Cotality shows that since October last year, properties with an estimated value below the 5% deposit guarantee scheme price caps have recorded stronger growth than higher priced homes.
Over the first six months of the expanded scheme, homes with a value under the price caps have increased in value by 6.7% compared with a 3.6% rise in value for properties with an estimated value above the price caps.
Six months growth trends
- Homes under the price cap: +6.7%
- Homes above the price cap: +3.6%
Momentum was building in the sub-price caps market prior to the scheme being expanded on October 1st, with the divergence opening around the time of the announcement in late August.
Possible drivers
Demand ’brought forward’: Anticipation of increased competition and price pressure after the scheme’s launch has likely brought forward demand from those who didn’t necessarily need to rely on the deposit guarantee.
Serviceability constraints: With higher home values and elevated interest rates, serviceability constraints are likely to be pushing demand toward lower-priced, more affordable properties.
Investor activity: Increased investor presence in the lower price segment, competing with first-home buyers and mainstream demand. Investors comprised 40% of mortgage demand in Q4, well above the decade average where investors typically comprise around one third of mortgage demand.
Regional differences
The pattern of stronger growth at values below the price caps is consistent across every capital city and regional market except Regional Western Australia & NT.
Sydney:
The largest value growth differential was recorded across Australia’s largest and most expensive city.
Homes with a value under the cap are up 4.1% over the past six months, while those above the cap have fallen by 1.1%, a 5.2 percentage point differential.
Across Australia, 81 of the 88 (92%) SA4-sub markets have shown a stronger growth rate for properties with a value under the price caps.
Overall, the expanded deposit guarantee appears to have amplified demand for lower-priced homes, adding to competitive tension for more affordable housing options and contributing to faster growth in this segment compared to higher-priced properties.
The selection set of suburbs with a median value below the prices caps is becoming smaller as values rise.
- Also read:Brisbane’s Auction Market Just Crashed – What the RBA’s Rate Pause Really Means for Property Investors | Property Insiders

- Also read:Latest Property Price Forecasts. Australian Property Market Outlook 2026: Where To Now After The Rate Rise & Budget Changes.

- Also read:This week’s Australian Property Market Update – Latest Data, State by State June 23rd 2026

- Also read:Everything you need to know about the state of Australia’s property markets in 20 charts – June 2026

- Also read:National Weekly Auction Report – June 20th 2026 | Auction Markets Fall as Winter Chill Approaches

At the end of September last year, just prior to the expanded deposit guarantee going live on October 1st, 48.6% of suburbs nationally had a median house value below the price caps, and 92.7% of suburbs had a median unit value below the caps.
By the end of March this portion had dropped to 39.5% and 89.1%.
Darwin, which is the only capital city where price caps weren’t adjusted higher in October, is recording the smallest portion of suburbs with a median below the price caps.
10.3% of suburbs have a median house value below the $600k cap, down from 32.4% in September, and 95.2% of suburbs of a median unit value below the caps.
Perth isn’t far behind, with only 11.6% of suburbs recording a median house value below the price caps in March, down from a third in September last year.
72.6% of Perth suburbs have a median unit value below the price caps, the lowest portion of any capital or rest of state region.
Despite its sheer unaffordability, Sydney has the highest portion of suburbs where the median house value falls below the price caps, with 46.8% of suburbs recording a median below the cap of $1.5m, down marginally from 47.8% of suburbs in September last year.
The higher portion is partially explained by the higher price cap; at $1.5m, Sydney’s price cap is more than $500k higher than any other capital city.
The other explanation comes back to relatively mild value growth, with Sydney house values rising only 0.4% over the past six months.
The other barrier for first home buyers is demonstrating an ability to service a mortgage with a 95% loan to valuation ratio (LVR).
Higher home values imply higher loan amounts.
The average first home buyer loan amount increased by 7.7% in the December quarter (according to ABS lending indicators) to $606,400.
Since then, we have seen interest rates rise by half a percent, reducing borrowing capacity for a household with an income of $100k by about $34,300.
Taking into account the three-percentage point serviceability buffer alongside the average variable mortgage rate of 6.01% in March, today’s first home buyers will need to demonstrate an ability to service their mortgage at an interest rate around 9% or higher, with a clear upside risk that this figure will move higher.
Outlook
Overall, it is likely first home buyer deposit guarantee will gradually lose its stimulatory power, with more homes exceeding the price thresholds and a growing portion of prospective buyers running into a finance hurdle that is set to rise further.
Demand from first time buyers looking to purchase a house is likely to skewed towards the outer fringes of the capital cities or regional markets where price points are lower.
More affordable and widespread options are available to first home buyers across the unit market, which is likely to become an increasingly popular option for budget conscious buyers looking to participate in the deposit guarantee scheme.


