


Key takeaways
Deposit timelines are blowing out as entry level prices rise much faster than incomes, making it harder for first-home buyers to enter the market.
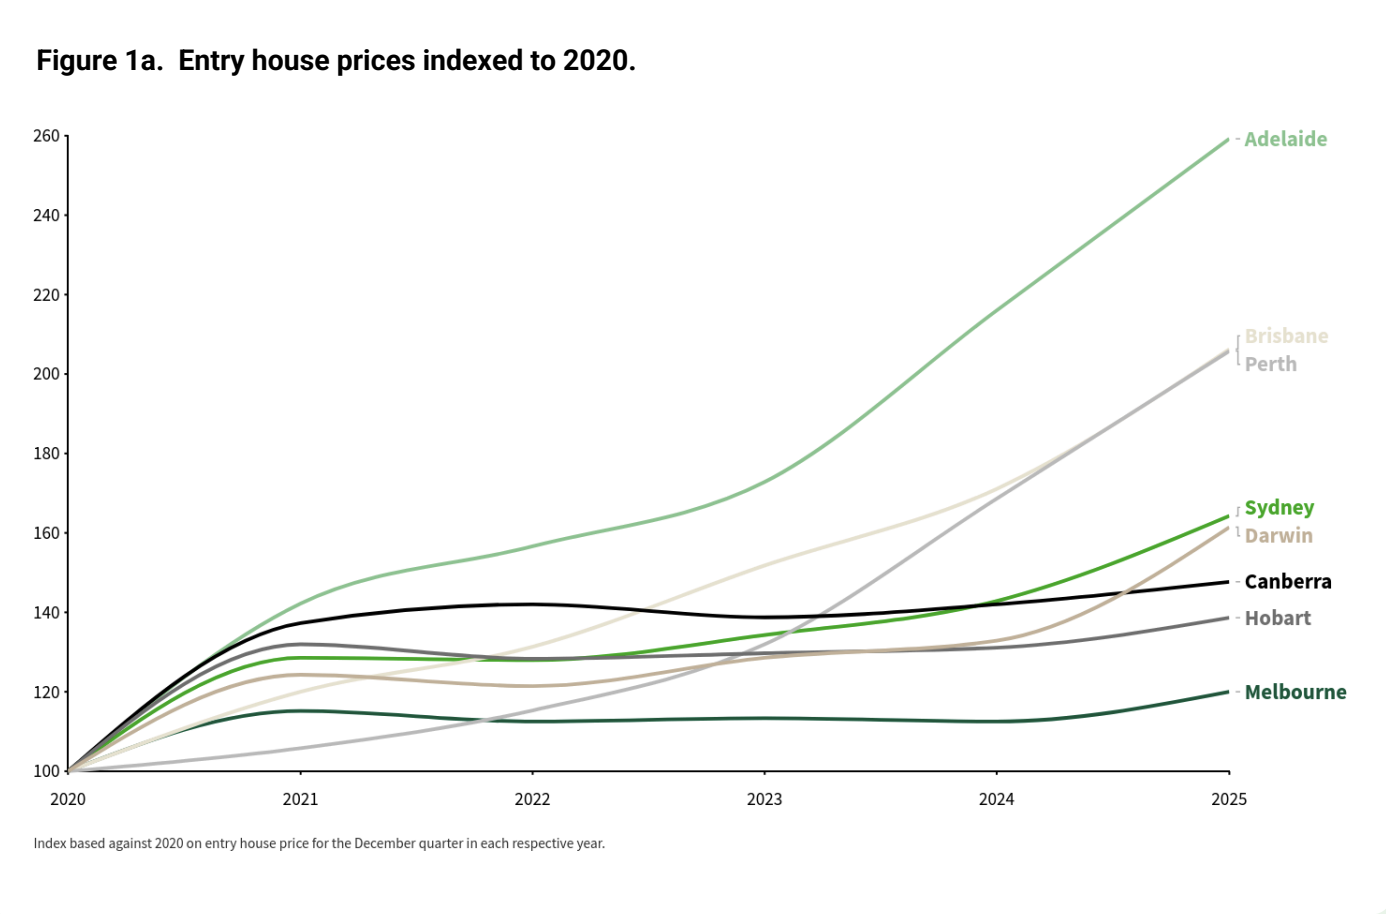
Affordability gaps between cities are widening, with Brisbane, Adelaide and Perth now almost as challenging as Sydney for first-home buyers.
Units are no longer the affordable fallback, with Brisbane buyers now taking longer than Sydney to save for an entry-priced unit.
Mortgage stress remains widespread, even after rate cuts, as repayments on entry-priced homes exceed recommended thresholds in all capitals for houses.
Affordability pressures are now structural, meaning policy will need to go beyond interest rates to address deposits, supply constraints and entry barriers.
If you’ve followed the property market for any length of time, you already know first-home buyers have never had it easy.
But the latest numbers from the Domain First-Home Buyer Report 2026 suggest the challenges have shifted into a new gear.
The report found that rising entry-level home prices have offset the benefits of lower borrowing costs and government support measures, leaving affordability under sustained pressure and signalling a structural shift in the market, where tight housing supply and escalating prices, rather than interest rates, are now the primary barriers to first-home ownership.
Key findings :
Here some interesting findings from the Domain report
Entry House and Unit Prices are Rising Significantly Faster than Wages
- In the past five years, national entry-level houses increased 68% and units 30%, while wages grew just 21%, unable to keep pace with inflation which rose 23%.
Entry house and unit prices.
| Area | Entry houses | Entry units | ||||
| Entry price | Annual change | 5-year change | Entry price | Annual change | 5-year change | |
| Sydney | $1,150,000 | 15.0% ($150,000) | 64.3% ($450,000) | $645,000 | 4.0% ($25,000) | 9.7% ($57,000) |
| Melbourne | $720,000 | 6.7% ($45,000) | 20.0% ($120,000) | $441,250 | 1.3% ($5,875) | -2.4% (-$10,750) |
| Brisbane | $856,000 | 20.6% ($146,000) | 106.3% ($441,000) | $660,000 | 24.0% ($127,875) | 80.8% ($295,000) |
| Adelaide | $720,000 | 20.0% ($120,000) | 159.2% ($442,250) | $508,000 | 12.9% ($58,000) | 84.7% ($233,000) |
| Perth | $780,000 | 22.1% ($141,000) | 105.8% ($401,000) | $550,000 | 25.0% ($110,000) | 83.9% ($251,000) |
| Hobart | $623,894 | 5.7% ($33,894) | 38.6% ($173,894) | $470,000 | 4.4% ($20,000) | 34.1% ($119,500) |
| Darwin | $565,000 | 21.5% ($100,000) | 61.4% ($215,000) | $355,000 | 21.4% ($62,625) | 42.0% ($105,000) |
| Canberra | $780,000 | 4.0% ($30,000) | 47.7% ($251,876) | $420,472 | -3.5% (-$15,278) | 12.1% ($45,472) |
| Australia | $685,000 | 12.3% ($75,000) | 67.9% ($277,000) | $515,099 | 7.3% ($35,099) | 30.4% ($120,099) |
The time Required to Save a 20% Deposit for an Entry-Priced Home has Increased in Every Capital City
- In Darwin, our most accessible market, a 20% deposit for an entry-level unit now takes 2 years and 7 months, up 5 months in just a year. In Sydney, the least accessible city, it takes 7 years and 7 months for an entry-level house, up 10 months in a year. Brisbane now ranks second, followed by Adelaide and Perth.
Mortgage Repayments Are Consuming a Significantly Larger Share of Household Income
- Across the combined capitals, repayments on an entry-level house now average 48.9% of income, an increase of nearly 24 percentage points over five years. For units, repayments account for 30.9%
The Traditional Unit Entry Point Is Narrowing
- Units have traditionally provided a faster pathway into home ownership. However, in several fast-growing capitals, this advantage is shrinking.
For the first time on record, Brisbane has overtaken Sydney as the city requiring the longest time to save for an entry-priced unit. In Adelaide and Perth, the difference in saving time is now only 18 months or less than saving for an entry-level house, reducing the relative affordability advantage of units.
The time to save for a 20% deposit on an entry-priced home and unit for a couple aged 25-34.
| Area | Entry houses | Entry units | |||
| Dec-25 | Dec-24 | Annual change | Dec-25 | ||
| Sydney | 7y 7m | 6y 9m | 10m | 4y 5m | |
| Melbourne | 5y 3m | 5y | 3m | 3y 4m | |
| Brisbane | 6y 3m | 5y 4m | 11m | 4y 11m | |
| Adelaide | 5y 7m | 4y 9m | 10m | 4y | |
| Perth | 5y 4m | 4y 6m | 10m | 3y 10m | |
| Hobart | 5y | 4y 10m | 2m | 3y 10m | |
| Darwin | 4y | 3y 5m | 7m | 2y 7m | |
| Canberra | 5y 1m | 5y | 1m | 2y 10m | |
| y = year, m = month. | |||||
Domain’s Chief of Research and Economics, Dr Nicola Powell, said First-home buyers are being locked out of more markets than ever before, and those who do manage to buy are taking on greater financial risk than at any time in the past decade.
“Interest rate cuts in 2025 offered some relief, but they weren’t enough to undo years of strong price growth and rising household debt. In many markets, affordability actually worsened even as rates fell,” said Dr Powell.
What’s most concerning is that this is no longer just a Sydney problem. Brisbane, Adelaide and Perth, once seen as more attainable, have seen rapid growth in entry-level prices, pushing them much closer to the least affordable markets.
Units have traditionally been the stepping stone into home ownership, but even that pathway is narrowing. In several capitals, unit buyers are now stretching themselves into mortgage stress.”
While initiatives such as the 5 per cent Deposit Scheme and Help to Buy have helped reduce saving times and, in some cases, mortgage serviceability, the report found broader affordability challenges remain, particularly in higher-priced markets where repayment risks remain high.
This shows the affordability challenge has become a deeper, structural problem.
Getting into the market now depends more on where you live, how much you earn and whether you have family support than simply how well you save. Without sustained action to increase supply and tackle upfront and ongoing costs, there’s a real risk home ownership could slip permanently out of reach for many young Australians.”
Affordability has been completely redrawn across Australia
Sydney remains the most difficult place to buy a house, but Domain's data shows Brisbane has climbed into second place, overtaking cities that once offered comparatively easier entry points.
Adelaide and Perth have also moved up the difficulty ranks, and both now require longer saving periods for houses than Melbourne and Canberra.
But the more surprising shift is happening in the unit market.
Brisbane has, for the first time, overtaken Sydney as the city where it takes the longest to save for an entry-priced unit. Adelaide and Perth aren’t far behind.
This marks a significant change: units have long acted as the “affordable alternative,” the first foothold on the ladder. That foothold is now slipping away in several capitals.
Dr Powell’s comment about rapid growth at the lower end is the key to understanding this reshuffle:
"It’s not simply that property prices are rising, it’s that entry-level property prices are rising faster than the rest of the market. For first-home buyers, that hits hardest."
Even with rate cuts, mortgage stress isn’t easing
Once buyers get into the market, the next challenge is sustainability, as mortgage serviceability remains stretched across the country.
- Also read:Melbourne property market forecast for 2026 | Is it a good time to invest in Melbourne?

- Also read:Latest Property Price Forecasts Revealed. Australian Property Market Outlook 2026: Where To Now After The Rate Rise.

- Also read:Brisbane Property Market Forecast [2026] – What’s Ahead & Where to Invest

- Also read:Sydney property market forecast for 2026. Is it a good time to invest in Sydney?

- Also read:March Home Prices Still Rising | Latest stats from Dr. Andrew Wilson

The report shows that every capital city now sits above the "recommended" 30% threshold for entry-priced houses.
Sydney is the standout with repayments consuming 61.8% of income for a young couple.
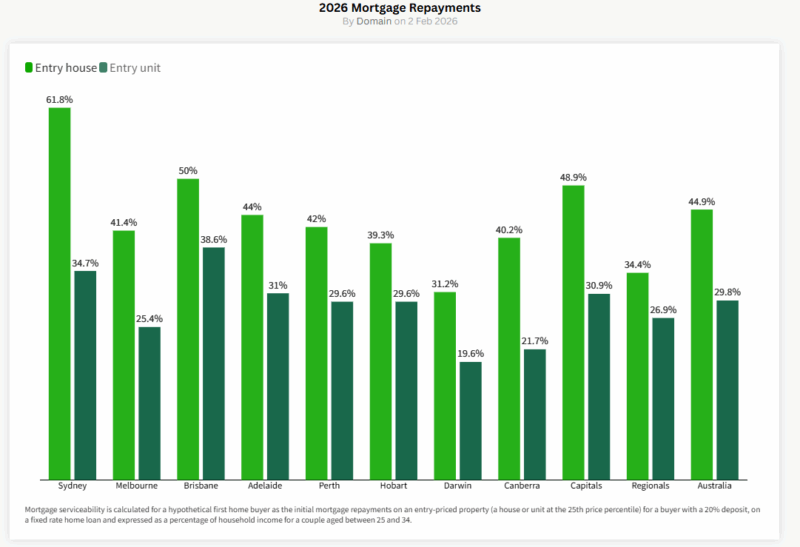
And other capitals aren’t in comfortable territory either; Brisbane sits at 50%, Adelaide at 44%, and Perth at 42%.
Even the unit market, which historically offered more manageable repayments, is showing signs of strain.
In Sydney, Brisbane and Adelaide, unit buyers are now also in mortgage-stress territory.
What’s most telling is that the 2025 interest rate cuts didn’t materially improve serviceability.
They simply stopped things from deteriorating further.
This indicates a shift in the primary driver of affordability challenges: it’s price growth, not borrowing costs, that is doing the heavy lifting.
What this means for the market and for investors
These findings have flow-on effects on our housing markets.
When first-home buyers face rising barriers, more of them remain renters for longer. That reinforces rental demand, pushes vacancies lower, and increases pressure on supply, conditions that typically support rental growth and investment returns.
Also, I believe a healthy property market needs a steady flow of new entrants.
If younger Australians struggle to get onto the ladder, the entire progression of buying, selling, upgrading and downsizing slows.
Markets become more segmented and more dependent on investor activity, which increases exposure to regulatory intervention and political scrutiny.
We’re also seeing behavioural adaptation as many potential first home buyers are now choosing rentvesting, buying further from employment hubs, or shifting to smaller dwellings simply to gain a foothold.
Others are using schemes such as the First Home Super Saver Scheme, the 5% Deposit Scheme, or Help to Buy.
The bottom line
Australia’s affordability landscape is changing in ways that go far beyond interest rates.
The most significant challenge for first-home buyers today is the widening gap between what they can save and what entry-level homes cost.
Deposits are taking longer to accumulate, repayments remain stretched, and the “starter home” category is disappearing in several capitals.
For investors, this reshaping of demand offers both opportunity and risk.
Cities where first-home buyers are increasingly locked out tend to see stronger rental markets, but they may also become more sensitive to policy shifts and affordability pressures.
For homeowners and families, the affordability ceiling affects mobility, lifestyle choices and the ability to plan confidently for the future.
And for policymakers, the message is that affordability challenges are structural and require a rethinking of housing policy.


