Key takeaways
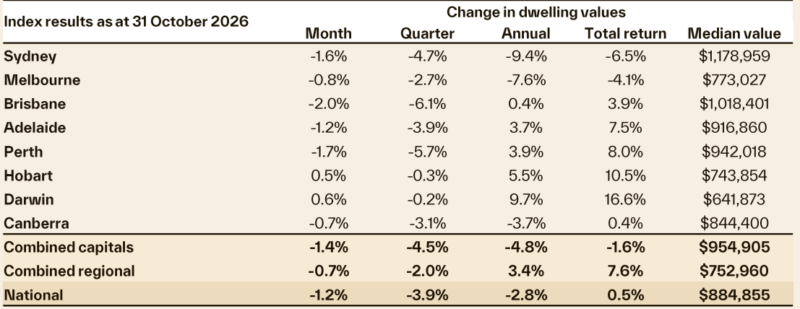
Cotality’s national Home Value Index (HVI) down 1.2% in October, taking the downturn into a seventh consecutive month.
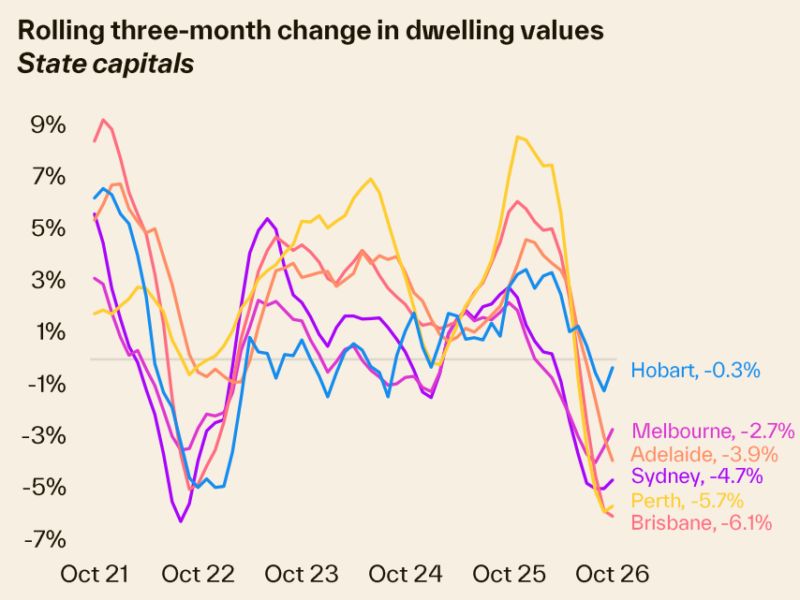
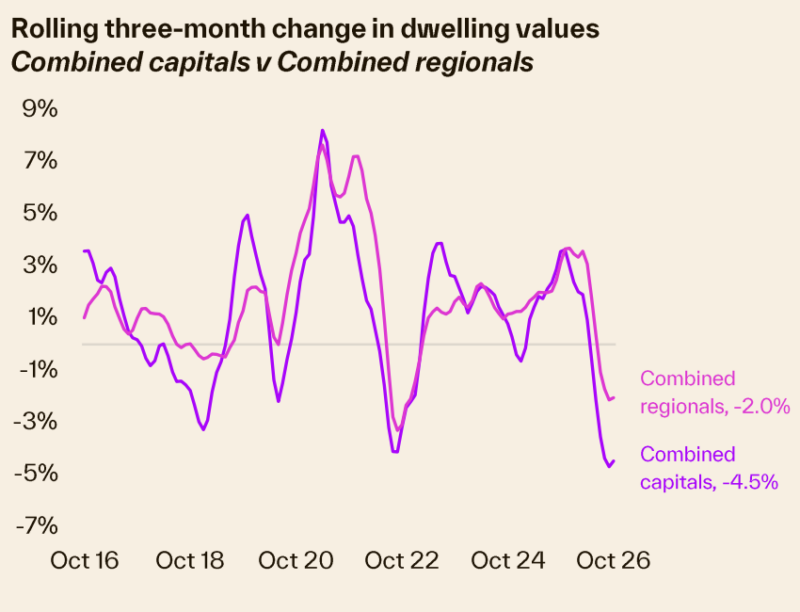
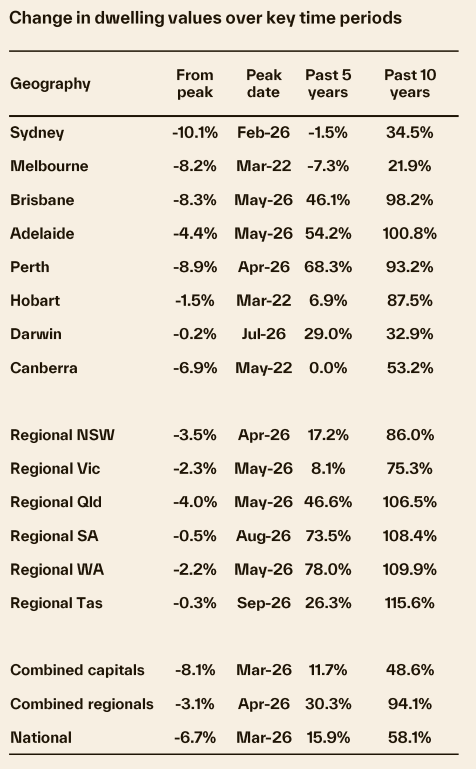
The speed of decline is tracking faster than any previous downturn over the past 40 years, with capital city values down 8.1% in seven months.
Brisbane (-2.0%) and Perth (-1.7%) values are falling at a faster rate than Sydney (-1.6%).
Home sales have dropped sharply as demand has weakened, with estimates of the volume over the past three months 23% lower than a year ago and 18% below the previous five-year average.
Auction clearance rates across the combined capitals consistently tracking below 50% and private treaty sales taking longer to sell with larger vendor discounts.
Vendors are less active, with the flow of new listings almost 18% below average, but the slower rate of absorption has seen capital city listings rise to the highest level for this time of year since 2019.
Amid low confidence and the risk of further rate hikes, the housing outlook is expected to remain subdued through the rest of the year and into 2027
Housing trends remained weak through the middle of spring , with Cotality’s national Home Value Index (HVI) down 1.2% in October, taking the downturn into a seventh consecutive month.
The national index is now 6.7% below its March peak, equivalent to a decline of approximately $63,400 in the value of the median Australian dwelling.
An array of headwinds continued to weigh on housing demand, even amid a shortage of new homes being built.
Affordability and serviceability constraints were the earliest factors weighing on housing demand, with these headwinds amplified by four interest rate hikes, persistently low confidence and ongoing cost-of-living pressures.
The Federal Budget has added to the downside pressure since mid-May.
The speed of the decline in home values is tracking at the fastest pace seen over the past forty years, with the combined capitals index down 8.1% in seven months.
Over the same number of months, the 2022-23 downturn had seen capital city values drop 7.0%, and the earlier 2017-19 downturn, which was the largest peak to trough decline on record at -8.2%, had recorded a 1.2% fall.
Brisbane and Perth have overtaken Sydney with the fastest pace of decline
Brisbane and Perth have overtaken Sydney with the fastest pace of decline, with dwelling values down 2.0% and 1.7% respectively in October, taking values 6.1% and 5.7% lower over the rolling quarter.
Sydney is a close third, with values down 1.6% over the month and 4.7% over the quarter.
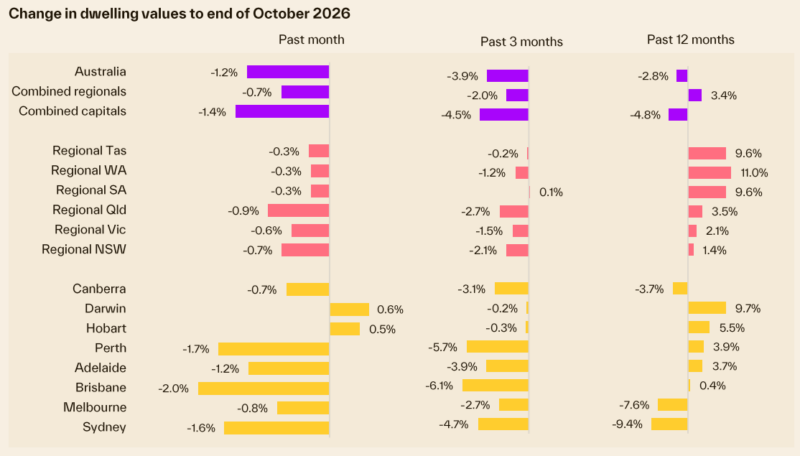
The mid-sized capitals, where home values recorded extreme growth conditions over the past six years, are now well and truly in a correction.
Virtually every suburb across Brisbane, Perth and Adelaide has recorded a drop in values over the past three months.
However, given the magnitude of the upswing prior to the downturn, most homeowners in these cities are likely to be sitting on a significant equity buffer.
For example, a 20% drop in Perth home values from their record high would only take the market back to levels recorded in around mid-2025.
Homeowners in Melbourne and Sydney aren’t in as strong an equity position, with Melbourne home values 7.3% lower than five years ago and Sydney values 1.5% below October 2021 levels.
ACT values are virtually unchanged from five years ago.
Drilling down to the broad value tiers, the market dynamic has become more uniform over recent months
Through the previous upswing, lower-quartile properties were leading the growth trend by some margin.
More recently, these trends have converged, especially across the mid-sized capitals, where there is now very little difference in growth rates across the broad value tiers.
The number of home sales has dropped sharply as demand has weakened.
Modelled estimates put the number of home sales over the past three months 23% lower than a year ago and 18% below the previous five-year average.
The decline in sales activity has been most significant across Sydney and Brisbane, down 30% and 29% respectively compared with a year ago.
With fewer buyers, selling conditions have also deteriorated.
Auction clearance rates across the combined capitals are consistently tracking below 50%, while private treaty metrics have also weakened.
The median time on market, at 39 days, is the highest since August 2020, while vendor discounting, at 4.7%, is the largest since May 2019.
The slower rate of absorption has seen capital city listings rise, reaching the highest level for this time of year since 2019.
The rise in advertised stock levels comes despite the flow of fresh listings tracking almost 18% below average.
Buyers have a lot more stock to choose from, they have more leverage and there isn’t the same urgency to buy as there was a year ago when home values were rising rapidly.
But despite this being a buyer’s market, they are noticeably absent, reflecting low confidence and ongoing serviceability barriers.
- Also read:National Weekly Auction Report – October 31st 2026 | Quiet October Home Auction Market Ends with Signs of Improvement

- Also read:Home Prices Continue to Steady Over October | Latest Property Market Stats

- Also read:Unemployment rises, housing approvals fall and Melbourne leads the auctions again | Property Insiders

- Also read:This week’s Australian Property Market Update – Latest Data, State by State October 27th 2026

- Also read:Latest Property Price Forecasts. Australian Property Market Outlook 2026-2027: Navigating a Market Correction

Outlook
Housing market conditions are likely to remain under downward pressure over the coming months and into next year, with the latest inflation data reinforcing the prospect that interest rates have further to rise.
Inflation came in above expectations in September, with annual headline inflation rising to 4.3%.
The quarterly trimmed mean measure increased by 1.0%, the largest quarterly rise since the September quarter last year, with the annual rate rising to 3.7%, well above the RBA’s 2 - 3% target range.
With inflationary pressures proving more persistent than expected, financial markets have substantially increased the probability of another rate hike on Melbourne Cup Day, while the risk of further tightening beyond November has also risen.
Market pricing immediately following the inflation release implied around an 85% probability of a November hike.
Higher interest rates are likely to further constrain housing demand through reduced borrowing capacity and tougher loan serviceability assessments.
The Reserve Bank of Australia has already lifted the cash rate by 100 basis points this year, taking it to 4.60%.
Another 25 - basis point hike would take the average variable mortgage rate to around 6.7% for owner occupiers.
Another rate hike would mean borrowing capacity has dropped by around 11.5%, or more than $105,000 through the rate - hiking cycle to date, more than offsetting the approximately $63,400 decline in the national median dwelling value since its March peak.
For prospective buyers reliant on credit, higher servicing costs and reduced borrowing capacity are likely to remain a substantial hurdle, alongside elevated living costs and stretched household balance sheets.
1. The labour market is also showing clearer signs of softening.
The unemployment rate reached 4.7% in September, its highest level since 2021, while annual employment growth slowed to 1.2%.
A gradually loosening labour market is likely to weigh on household confidence and income growth, while also increasing the risk of mortgage stress if unemployment rises more substantially.
2. Persistently weak consumer sentiment is another important headwind for housing demand.
With households facing the prospect of further rate hikes alongside ongoing cost - of-living pressures and a softer labour market, confidence is likely to remain subdued.
Historically, periods of weak consumer sentiment have been associated with lower housing turnover as households become more cautious about making high - commitment decisions such as purchasing a home.
3. Selling conditions are also shifting more firmly in favour of buyers.
Advertised supply has risen across many markets due to a slower rate of absorption.
As homes take longer to sell, listings are accumulating, providing buyers with more choice, less urgency and greater scope to negotiate.
Vendors are likely to face increasing pressure to adjust their price expectations to meet the market.
4. Changes to taxation policies announced in the Federal Budget remain another source of downside risk.
Investor demand has pulled back sharply following the less favourable tax treatment of established investment properties, alongside higher interest rates and a broader reduction in housing demand.
The number of new investor loan commitments fell 8.6% in the June quarter, the sharpest quarterly decline since September 2022.
5. Despite the growing list of demand -side headwinds, there are important factors that should help to contain the downturn.
Persistently low levels of newly built housing supply remain a key counterweight.
Elevated construction and development costs, capacity constraints and challenging project feasibility continue to limit the flow of new housing completions, while lengthy development timelines mean any meaningful improvement in approvals or commencements will take time to translate into completed dwellings.
Population growth has also slowed from the exceptional rates recorded over recent years but remains positive, continuing to add to underlying housing demand at a time when new supply remains insufficient.
Overall, the balance of risks remains skewed to the downside, with the decline in home values on track to be the largest in at least forty years.
The prospect of further interest rate hikes, reduced borrowing capacity, worsening serviceability constraints, softer labour market conditions, low consumer sentiment and weaker investment demand are likely to weigh on housing activity and values.
Insufficient levels of new housing supply and ongoing population growth should provide a degree of support.
The most likely outcome remains a gradual drift lower in housing values rather than a more material downturn, although the trajectory will depend increasingly on the path of inflation, interest rates and labour market conditions over the coming months.