

Key takeaways
Australians refinanced 618,966 loans in the year to September 2025 — far more than the 537,326 new loans issued.
Borrowers are actively restructuring debt as rates stabilise, with internal refinancing up 29% year-on-year. This signals households are preparing for the next phase of the market.
Loans for new builds, land and construction dropped 3.5%, now sitting 38% below their 2021 peak.
This deepening decline means fewer homes entering the pipeline, which will continue to push buyers toward established properties — and place upward pressure on prices.
Investor loans rose 9%, now 32% above the 2023 lows.
Victoria led the country with a 13% surge, thanks to stronger yields, population growth and more attractive pricing.
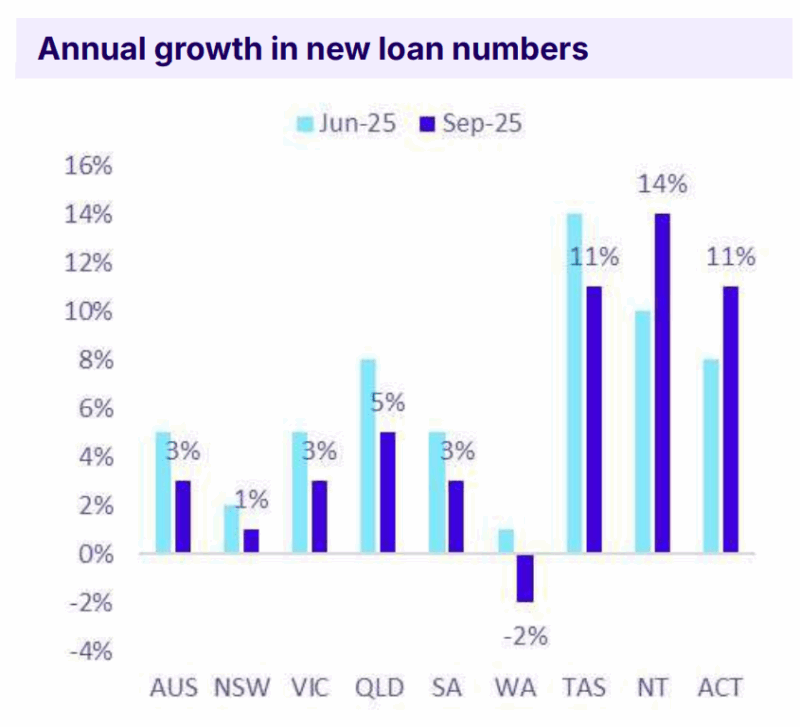
Owner-occupier lending grew 3%, with Queensland leading at 5% annual growth.
While not booming, demand has stabilised and remains 9% above the 2023 trough, signalling a cautious but consistent recovery.
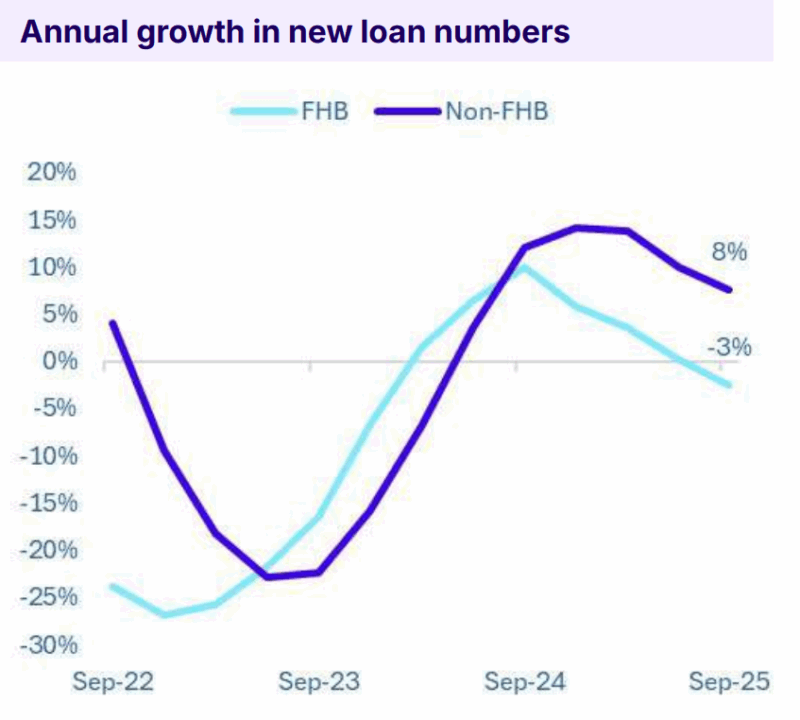
First home buyer loans declined 3%, even as other buyer groups grew 8%.
If you’ve been watching Australia’s property market and feeling like the numbers don’t quite add up, you’re right.
Refinancing is exploding, new-build lending is falling off a cliff, and investors are quietly staging a comeback.
Yet when you dig deeper into the latest data, you start to see a much clearer story about where our market is heading, and why.
The newest Mortgage Insights Report from Money.com.au, based on ABS Lending Indicators to September 2025, reveals trends that every property investor and homeowner should be paying attention to.
The patterns aren’t subtle, and they have real implications for prices, borrowing capacity and long-term strategy.
Refinancing hits a 4-Year high - a big shift in borrower behaviour
According to Money.com.au, Australians refinanced 618,966 loans in the year to September 2025, the highest level in four years and significantly higher than the 537,326 new loans written during the same period.
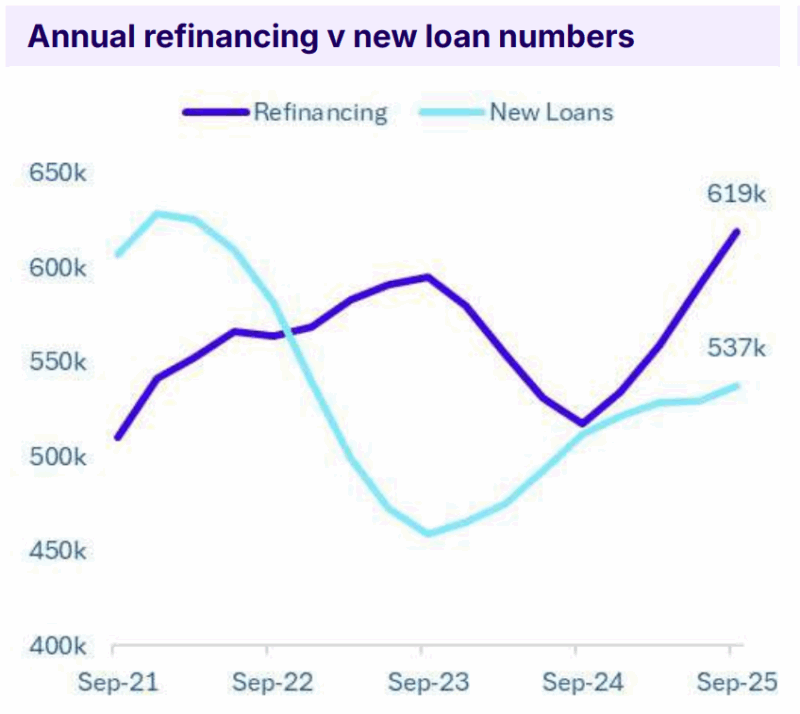

Note: That means refinancing now outnumbers new mortgage lending by more than 80,000 loans.
This tells us a few things:
-
Homeowners are actively hunting lower rates or better loan structures.
-
Uncertainty around interest rates is pushing borrowers to tighten up their finances.
-
Banks are fighting to keep customers, internal refinancing is up 29% year-on-year, almost double the growth in external switching.
In other words, Australians are reshaping their debt before the next phase of the cycle plays out. That’s classic behaviour during a turning market.
New-build lending is slumping - and that’s fuel for price growth
One of the more alarming findings from Money.com.au's report is the continued decline in lending for new builds, land and construction.
These loan types fell 3.5% over the year, now sitting a staggering 38.3% below their 2021 peak.
As their Property Expert Debbie Hays puts it:
“When borrowing for new builds continues to go backwards, it’s a clear sign that supply isn’t keeping up, and more buyers are being pushed to compete for existing properties.”
This is the core issue driving our affordability challenges.
If fewer homes are being built today, fewer will be available tomorrow, and that squeezes buyers into the same pool of established properties.
Hays explains that’s why we’re seeing loan sizes for owner-occupiers ($674,860) and investors ($676,797) converging.
Competition is pushing everyone into the same scarce stock, lifting debt levels across the board.
This supply-side weakness is one of the biggest tailwinds for future price growth.
Investors are returning, and Victoria is leading the charge
Investor lending has rebounded strongly, rising 9% in the year to September 2025, with 205,533 loans written.
That places investor activity 32% above the 2023 lows, according to Money.com.au.
But the real standout is Victoria.

Despite the narrative of the last couple of years, investor lending in Victoria grew 13%, the strongest of any state.
As Money.com.au notes, Melbourne’s improving rental yields, population resurgence and more palatable price points are key drivers.
The investor market share now sits at:
-
Queensland: 23.4%
-
Victoria: 23.2% — almost neck-and-neck
-
NSW: 11%
-
SA: 10%
This shift suggests investors are positioning themselves ahead of the next upswing.
They always return early, and this cycle is no different.
- Also read:National Weekly Auction Report – June 13th 2026 | Auction Clearance Rates Modest but Reasonably Steady Despite Listings Surge

- Also read:Latest Property Price Forecasts. Australian Property Market Outlook 2026: Where To Now After The Rate Rise & Budget Changes.

- Also read:Australia’s Rental Crisis Is Getting Worse – And the “Solutions” May Be Making It Worse | Property Insiders

- Also read:Supply Surges, Asking Prices Stall as Housing Market Reaches Turning Point | Latest SQM Listing Data
- Also read:Home Prices Now Falling Following Rate Rises | Latest stats from Dr. Andrew Wilson

Owner-occupiers are recovering gently, led by Queensland
Owner-occupier loans rose 3% over the year, reaching 331,793 loans, with Queensland at the front of the pack at 5% annual growth.
It’s not fast growth, but it is steady and consistent.
Money.com.au highlights that owner-occupier activity remains 9.3% above the 2023 trough, indicating a market that’s normalising, even if borrowing capacity remains tight.
The only major state going against the trend is WA, with a slight 2% decline.
First Home Buyers are losing ground
The group struggling the most right now is first home buyers.
Money.com.au reports FHB loans fell 3% annually, while all other buyer categories grew 8%.
Even with the expanded First Home Guarantee kicking in from October 2025, their analysts expect only a marginal improvement because the real challenges haven’t changed:
-
High purchase prices
-
Stretched borrowing limits
-
Limited new housing supply
As Ms Hays explains:
“The expanded First Home Guarantee will give first home buyers a lift, but only at the margins… it doesn’t solve the bigger issues.”
This is exactly why first home buyers need smarter strategy, not just government support.
What this all means for investors and homeowners
Let’s step back and look at the broader picture.
1. This is a classic pre-upswing market.
Refinancing peaks tend to occur as borrowers prepare for changing rate conditions.
2. The supply crunch is worsening.
New-build lending is falling when we desperately need more homes. This imbalance will keep upward pressure on prices.
3. Investors are quietly positioning themselves.
They’re returning early, as they always do, and capitalising on opportunities in undervalued markets like Melbourne.
4. Owner-occupiers are stabilising but still cautious.
Demand is recovering, but not yet booming, which often precedes a broad-based rise.
5. First home buyers risk being left behind.
Until supply improves and borrowing power increases, the gap will widen.
Final thoughts
The latest analysis from Money.com.au paints a picture of a market that’s shifting below the surface, not crashing, not overheated, but quietly reorganising itself for the next phase.
Refinancers are tightening their finances. Investors are stepping back in. Supply is falling at the worst possible time.
And prices, inevitably, will respond to that imbalance.
For those who understand the cycle and take a strategic, long-term view, there are opportunities emerging that most people won’t recognise until much later.


