


Key takeaways
Rents have continued to rise generally for both houses and units over July although the typically quieter mid-winter period has contributed to higher vacancy rates in some capitals.
House vacancy rates remain clearly low although some have continued to ease marginally over the month reflecting typically reduced demand over the winter period.
Annual unit rents have increased solidly in nearly all capitals with Darwin, Sydney and now Perth highest up by 18.2%, 12.7% and 7.7% respectively.
The recent surge in home rents has continued over July despite the usual mid-winter constraints on demand placing upward pressure on vacancy rates in some capitals.
Rents have continued to rise generally for both houses and units over July although the typically quieter mid-winter period has contributed to higher vacancy rates in some capitals.
Canberra was the top performer with house rents surging by 2.6% over the month followed by Melbourne higher by 1.7%, Brisbane up 1.3%, Adelaide higher by 1.1% and Sydney up 0.3%.
Perth and Darwin house rents were steady over the month with Hobart falling by 1.2%.
Sydney continued to report the highest capital city house rents over June and higher yet again at $878 per week with Hobart now the most affordable and lower at $618 per week.
Most capitals continue to report solid to strong annual house rent growth with Darwin now the top performer up by 13.3% followed by Sydney up 9.7%.
House vacancy rates remain clearly low although some have continued to ease marginally over the month reflecting typically reduced demand over the winter period.
Median Weekly Asking Rents July 2026 - Houses
| Rent | Month | Year | Vacancy Rate | Change | |
| Sydney | $878 | 0.3% | 9.7% | 1.5% | ↑ |
| Melbourne | $620 | 1.6% | 5.1% | 1.3% | ↑ |
| Brisbane | $709 | 1.3% | 7.4% | 0.9% | ↑ |
| Adelaide | $663 | 1.1% | 3.5% | 0.9% | ↔ |
| Perth | $750 | 0.0% | 7.1% | 0.9% | ↔ |
| Hobart | $618 | -1.2% | 4.7% | 0.8% | ↓ |
| Darwin | $850 | 0.0% | 13.3% | 0.2% | ↔ |
| Canberra | $745 | 2.1% | 6.4% | 1.5% | ↔ |
Units
Unit rental vacancy rates generally eased over July however rents were generally higher or steady over the month.
Sydney was the top monthly performer with unit rents rising by 3.4% followed by Hobart higher by 2.2% and Adelaide up 1.4%. Melbourne, Brisbane, Perth, Darwin and Canberra rents were steady over the month.
- Also read:Latest Property Price Forecasts. Australian Property Market Outlook 2026-2027: Navigating a Market Correction

- Also read:Brisbane Property Market Forecast [2026 & Beyond] – What The Olympics Decade Means for Investors.
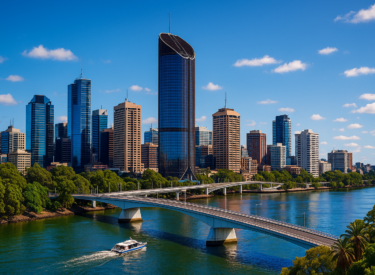
- Also read:Melbourne property market forecast for 2026 & 2027 | Separating the fundamentals from the sentiment
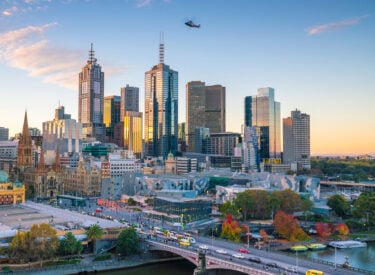
- Also read:Sydney property market forecast for 2026 and 2027 | Why the short-term softness is a long-term opportunity
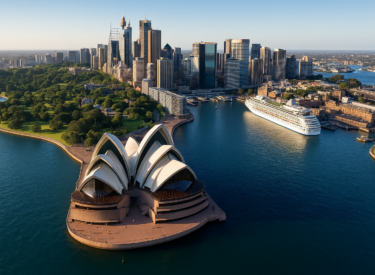
- Also read:Adelaide housing market update | September 2026

Annual unit rents have increased solidly in nearly all capitals with Darwin, Sydney and now Perth highest up by 18.2%, 12.7% and 7.7% respectively.
Sydney also remains the clear leader for weekly unit rents and higher at $845, with Hobart still clearly the most affordable but also higher again at $530 per week.
Although capital city unit vacancy rates were mostly higher over the month they generally remain at very low levels.
Median Weekly Asking Rents July 2026 - Units
| Rent | Month | Year | Vacancy Rate | Change | |
| Sydney | $845 | 3.4% | 12.7% | 1.7% | ↑ |
| Melbourne | $630 | 0.0% | 6.3% | 2.3% | ↑ |
| Brisbane | $680 | 0.0% | 4.6% | 1.2% | ↑ |
| Adelaide | $560 | 1.4% | 6.7% | 1.0% | ↔ |
| Perth | $700 | 0.0% | 7.7% | 1.0% | ↑ |
| Hobart | $530 | 2.2% | 4.4% | 1.1% | ↑ |
| Darwin | $650 | 0.0% | 18.2% | 0.4% | ↔ |
| Canberra | $600 | 0.0% | 0.4% | 2.7% | ↑ |
Final note
The recent surge in home rents has continued over July despite the usual mid-winter constraints on demand placing upward pressure on vacancy rates in some capitals.
Rental markets remain tight in most capitals with strong competition for available homes set to continue to place upward pressure on rents.
New taxation polices designed to significantly reduce investor numbers will likely exacerbate already drastic low supply of rental properties and result in higher rents.