


Key takeaways
Capital city home prices have continued to fall over September although the rate of decline has eased in most capitals compared to August results.
The national capital city median house price fell by 1.0% over the September quarter to $1,212,850 compared to the August quarter
National unit prices have also continued to decline over the September quarter compared to the August quarter, down by 0.8% to $701,092 – but are still higher by 0.7% compared to the September quarter 2025 result.
Although still falling, the unit market continues to narrowly outperform the house price market
Capital city home prices have continued to fall over September although the rate of decline has eased in most capitals compared to August results.
The national capital city median house price fell by 1.0% over the September quarter to $1,212,850 compared to the August quarter, according to the latest data from My Housing Market.
The September result was the fifth consecutive decline in national house prices but an improvement over the 1.8% fall reported over the previous month.
Annual national house prices are now lower by 1.7% with annual house price growth down sharply this year since the March peak of 10.9%.
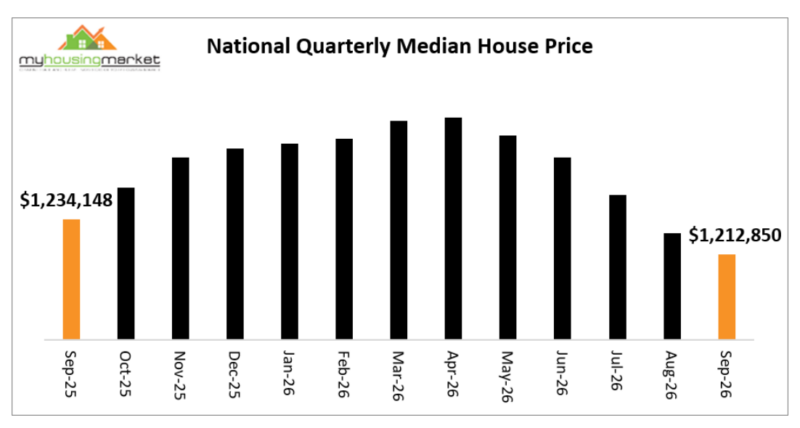
All capitals reported lower house prices over the month with Hobart falling 0.2%, Melbourne down 0.3%, Brisbane lower by 0.7%, Adelaide falling 0.9%, Darwin lower by 1.0%, Sydney falling 1.5% with Canberra and Perth each down 1.7%.
Most capitals continue to report annual house price growth with Perth, Darwin, Hobart and Brisbane the highest, up by 11.5%, 9.4%, 8.1% and 5.6% respectively. Sydney and Melbourne house
Quarterly Median House Prices September 2026
| Median | Month | This Year | 1 Year | 2 Year | |
| Sydney | $1,619,858 | -1.5% | -8.7% | -7.0% | -0.7% |
| Melbourne | $1,028,632 | -0.3% | -8.3% | -6.4% | -2.3% |
| Brisbane | $1,162,685 | -0.7% | -0.3% | 5.6% | 18.2% |
| Adelaide | $1,076,860 | -0.9% | -2.0% | 3.5% | 11.2% |
| Perth | $1,157,869 | -1.7% | 3.5% | 11.5% | 22.8% |
| Hobart | $759,543 | -0.2% | 1.3% | 8.1% | 12.9% |
| Darwin | $782,120 | -1.0% | 2.9% | 9.4% | 27.2% |
| Canberra | $947,068 | -1.7% | -6.0% | -5.2% | 1.0% |
| National | $1,212,850 | -1.0% | -5.1% | -1.7% | 5.4% |
National unit prices have also continued to decline
National unit prices have also continued to decline over the September quarter compared to the August quarter, down by 0.8% to $701,092 – but are still higher by 0.7% compared to the September quarter 2025 result.
Although still falling, the unit market continues to narrowly outperform the house price market.
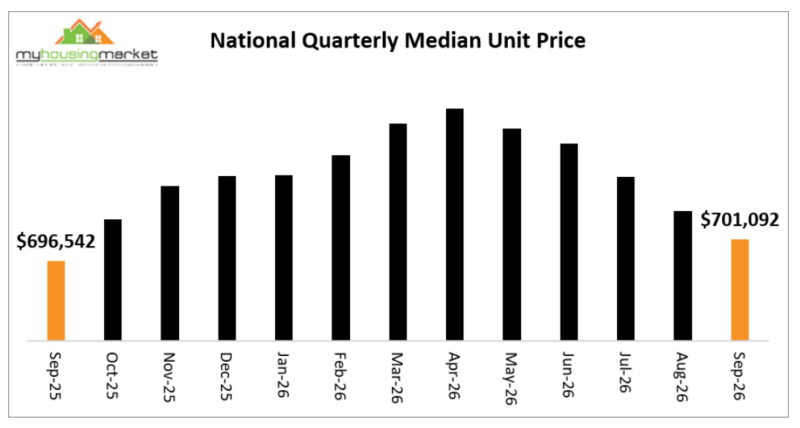
Similar to houses, all capitals reported lower unit prices over the month with Canberra and Darwin each down 0.6%, Melbourne and Sydney each falling 0.7%, Brisbane down 1.1%, Adelaide lower by 1.6%, Perth down 1.9% and Hobart falling 2.7% over the month.
Quarterly Median Unit Prices September 2026
| Median | Month | This Year | 1 Year | 2 Year | |
| Sydney | $787,001 | -0.7% | -2.8% | -2.1% | 1.8% |
| Melbourne | $573,763 | -0.7% | -4.1% | -1.8% | 1.8% |
| Brisbane | $738,491 | -1.1% | 3.9% | 13.6% | 32.3% |
| Adelaide | $614,809 | -1.6% | -2.4% | 4.7% | 17.9% |
| Perth | $639,570 | -1.9% | 3.1% | 11.2% | 27.6% |
| Hobart | $573,088 | -2.7% | 6.9% | 5.7% | 11.9% |
| Darwin | $467,529 | -0.6% | 8.9% | 21.9% | 32.8% |
| Canberra | $494,123 | -0.6% | -2.7% | -2.5% | -0.6% |
| National | $701,092 | -0.8% | -1.8% | 0.7% | 6.6% |
Similar to houses, all capitals reported lower unit prices over the month with Canberra and Darwin each down 0.6%, Melbourne and Sydney each falling 0.7%, Brisbane down 1.1%, Adelaide lower by 1.6%, Perth down 1.9% and Hobart falling 2.7% over the month.
Comment
Capital city home prices have continued to generally decline over September although the rate of decline has improved compared to the previous month reflecting some marginal improvement in activity into the early part of the spring selling season.
Reduced buyer and seller activity over recent months predictably reflects the impact on affordability and confidence of consecutive official interest rate increases in February, March and May, increased uncertainty over the economic outlook and significant changes to federal property taxes that have also impacted market activity.
The outlook for home prices through 2026 remains increasingly problematic particularly with stubbornly high inflation resulting in yet another increase in official interest rates announced in late September and with the prospect of more to follow.
The economy however remains reasonably robust although the national jobless rate has increased over recent months.
Underlying housing demand nonetheless continues to outpace low and diminishing housing supply although recent significant government policy initiatives have reduced high post-COVID migration levels with sharp reductions also in international student numbers.
Rental vacancy rates generally remain low in most capitals although recent data is indicating a pause in the recent surge in rentals - perhaps reflecting the impact of reduced migration.
Recently announced federal government changes to property taxes and self-funded superannuation designed to reduce investor activity will however act to place upward pressure on rents.
Capital city housing markets generally recorded higher house and unit prices over 2023, 2024 and surged over 2025 fuelled by rising buyer and seller confidence through sharp cuts to interest rates.
2026 is now clearly and consistently reporting lower home price outcomes compared to the previous three years with uncertainty remaining over the near-term future for interest rates. The prospect of higher interest rates has continued to generally dampen buyer and seller confidence particularly over the typically distracted and quieter winter period.
Although buyer and seller uncertainty has dampened the usual late winter, early-spring revival in housing market activity; underlying drivers generally nonetheless remain relatively positive notwithstanding growing uncertainty over the near-term trajectory of interest rates. Confidence and a steadying of interest rates clearly remain the key to a sustained housing market revival.
- Also read:Home Prices Down Again Over September – But Not as Much | Latest Property Market Stats

- Also read:53 years of valid reasons not to invest

- Also read:Why Testamentary Trusts Aren’t Just for the Rich: A Guide to Safeguarding Your Legacy Introduction

- Also read:Why the ALP’s Grand Plan to Build 1.2 Million Homes Is Destined to Fail – A Reality Check

- Also read:Here’s how I’ll be investing in property in 2023