


Key takeaways
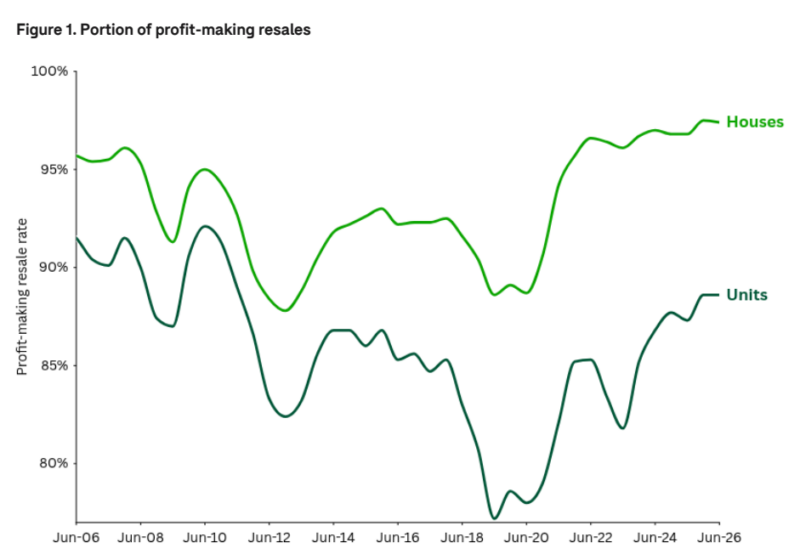
Most Australian property sellers are still making substantial profits. Around 97.4% of house resales and 88.6% of unit resales generated a gain.
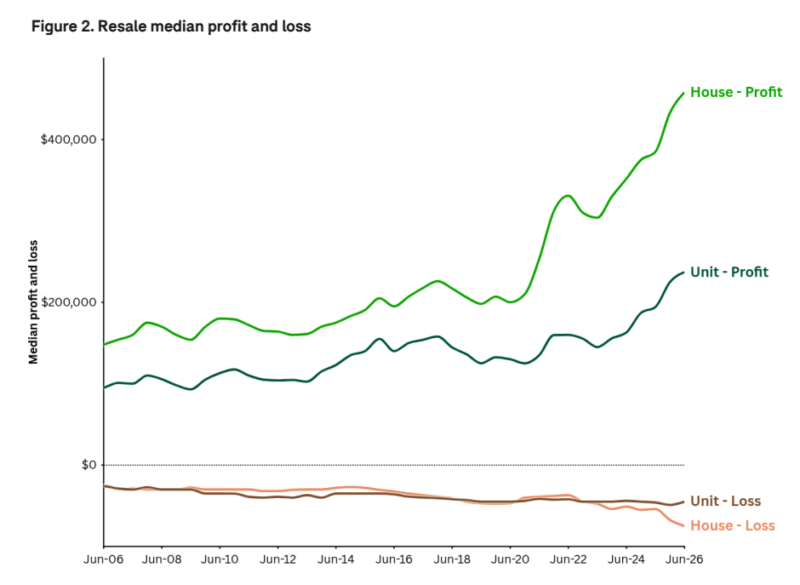
Median profits reached record levels. House sellers made a median gain of $458,000, while unit sellers gained $237,000.
Brisbane, Perth and Adelaide are now leading on profitability. Sydney still delivers the largest median house profits, but market leadership is shifting.
Melbourne’s unit market remains the weakest. More than one in four Melbourne apartment resales recorded a loss.
The market is becoming more selective. Asset quality, local supply and demand, and the ability to hold through the cycle will matter more from here.
For years, Australian homeowners have enjoyed a substantial equity dividend as rising property values quietly built wealth in the background.
While the headlines focused on interest rates, affordability pressures and predictions of a downturn, millions of homeowners benefited from holding property through several market cycles.
Domain’s latest Profit and Loss Report suggests this run may now be entering a more mature phase.
The proportion of properties resold for a profit remains close to historic highs, and median gains have reached new records.
However, the market is becoming more fragmented with some cities are still producing almost universal profits, while losses after a sale are becoming more common in selected markets, particularly parts of Melbourne and Canberra.
Now this does not mark the end of Australia’s property wealth story, it signals that future results will depend more heavily on market selection, asset quality and the ability to hold through changing conditions.
Australia’s equity dividend remains intact
According to Domain, 97.4% of house resales in the first half of 2026 generated a profit, only marginally below the 97.5% recorded in the second half of 2025. Unit profitability remained at 88.6%.
The dollar gains were even more impressive.
The median house resale profit reached a record $458,000, while the median unit profit rose to $237,000.
These results reflect years of accumulated capital growth, with owners typically holding their properties for around nine years, which is an important reminder that property wealth is generally created through time in the market rather than short-term speculation.
Prices may soften over a quarter or two, yet long-term owners can still remain hundreds of thousands of dollars ahead.
The first signs of fatigue are appearing
Although profitability remains exceptionally strong, Domain describes the recent easing as "the first crack in the profitability cycle."
Resale profitability tends to lag movements in prices, so even a small decline can confirm that broader market conditions have shifted.
Combined capital city house and unit prices recorded their first quarterly fall in more than three years during the June quarter, with Sydney, Melbourne and Canberra moving into softer territory.
Domain Chief Residential Economist Dr Nicola Powell said the research points to a “diverse picture,” which neatly describes the current market.
Australia is no longer experiencing a synchronised upswing.
Some cities continue to benefit from strong population growth and limited supply, while others are being weighed down by weaker confidence, affordability constraints or an oversupply of particular property types.
Brisbane and Perth now lead on profitability
One of the clearest trends in the report is the changing geography of housing wealth.
Perth recorded the highest share of profitable house resales, with 99.6% of transactions generating a gain.
Brisbane followed at 99.5%, while Adelaide recorded 98.8%.
Table 1. Profit and loss for house resales
| Profit | Loss | |||||
| % resales | Median profit | Annual change in profit | % resales | Median loss | Annual change in loss | |
| Australia | 97.4% | $458,000 | 19.0% | 2.6% | -$75,000 | 38.9% |
| Combined capitals | 97.3% | $552,000 | 20.0% | 2.7% | -$86,250 | 43.8% |
| Combined regionals | 97.6% | $352,000 | 19.3% | 2.4% | -$61,000 | 27.1% |
| Sydney | 97.6% | $739,500 | 5.8% | 2.4% | -$170,000 | 70.0% |
| Melbourne | 94.3% | $354,200 | -0.8% | 5.7% | -$68,500 | 37.0% |
| Brisbane | 99.5% | $629,056 | 32.4% | 0.5% | -$180,000 | 50.0% |
| Adelaide | 98.8% | $595,000 | 21.4% | 1.2% | -$171,500 | -44.7% |
| Perth | 99.6% | $610,000 | 41.9% | 0.4% | -$213,500 | 74.3% |
| Canberra | 94.3% | $385,000 | 5.9% | 5.7% | -$60,000 | -1.6% |
| Hobart | 96.5% | $340,000 | 12.8% | 3.5% | -$40,000 | -20.8% |
| Darwin | 98.6% | $250,000 | 86.6% | 1.4% | -$41,500 | 18.6% |
These cities also delivered record median profits.
Brisbane house sellers achieved a median gain of $629,056, Perth sellers recorded $610,000, and Adelaide sellers made $595,000.
Sydney still produced the largest median house profit at $739,500, confirming its position as Australia’s deepest equity market.
The same pattern appeared in units.
Brisbane led with 99.5% of unit resales producing a profit and a record median gain of $385,000. Adelaide reached $321,000 and Perth $294,000.
Table 2. Profit and loss for unit resales
| Profit | Loss | |||||
| % resales | Median profit | Annual change in profit | % resales | Median loss | Annual change in loss | |
| Australia | 88.6% | $237,000 | 22.0% | 11.4% | -$45,000 | -2.2% |
| Combined capitals | 86.1% | $225,000 | 24.3% | 13.9% | -$45,000 | -2.2% |
| Combined regionals | 96.9% | $265,000 | 17.8% | 3.1% | -$50,000 | 11.1% |
| Sydney | 88.0% | $199,000 | 5.9% | 12.0% | -$48,000 | 6.7% |
| Melbourne | 73.0% | $115,000 | 4.5% | 27.0% | -$46,000 | -6.1% |
| Brisbane | 99.5% | $385,000 | 51.6% | 0.5% | -$210,000 | 223.1% |
| Adelaide | 98.4% | $321,000 | 28.4% | 1.6% | -$254,000 | 586.5% |
| Perth | 98.5% | $294,000 | 72.9% | 1.5% | -$126,000 | 207.3% |
| Canberra | 82.8% | $100,000 | 5.3% | 17.2% | -$30,000 | 20.0% |
| Hobart | 95.1% | $185,000 | 2.8% | 4.9% | -$40,000 | 60.0% |
| Darwin | 85.8% | $115,000 | 101.8% | 14.2% | -$30,000 | -28.4% |
This reflects the strong price growth these markets have experienced since 2021, supported by relative affordability, population growth and tight housing supply.

Tip: Investors should be careful assuming that the strongest recent performers will automatically lead the next stage of the cycle.
Melbourne’s unit market remains the weakest link
The greatest divergence appears in the apartment market.
Nationally, almost nine out of ten unit sellers made a profit, yet only 73% of Melbourne unit resales generated a gain, which means 27% sold below their purchase price.
Canberra also weakened, with 17.2% of unit resales making a loss. Sydney recorded losses on 12% of unit sales and Darwin on 14.2%.
These figures reinforce an important point - there is no single Melbourne property market, just as there is no single Sydney or Brisbane market.
Houses, established apartments, high-rise investor stock and townhouses tend to perform very differently within the same city.
Melbourne’s weakness has been concentrated in segments with abundant supply and limited owner-occupier appeal.
Many generic apartments were built over the last decade or so primarily for investors, with little scarcity, limited land value and few distinguishing features.
- Also read:Latest Property Price Forecasts. Australian Property Market Outlook 2026-2027: Navigating a Market Correction

- Also read:Brisbane Property Market Forecast [2026 & Beyond] – What The Olympics Decade Means for Investors.

- Also read:Melbourne property market forecast for 2026 & 2027 | Separating the fundamentals from the sentiment

- Also read:Sydney property market forecast for 2026 and 2027 | Why the short-term softness is a long-term opportunity

- Also read:Adelaide housing market update | September 2026

That does not mean all Melbourne apartments are poor investments - larger, established apartments in tightly held buildings with strong owner-occupier appeal operate in a very different market from high-density investor towers.
Losses remain rare, but can be costly
Only 2.6% of house resales nationally recorded a loss, although the median loss widened to a record $75,000.
Among units, 11.4% sold at a loss, with the median amount sitting at $45,000.
Interestingly, some of the largest losses occurred in otherwise strong markets.
Perth’s median house loss reached $213,500 and Brisbane’s $180,000, despite fewer than half of one per cent of sales in either city making a loss.
Adelaide recorded the largest median unit loss at $254,000, followed by Brisbane at $210,000 and Perth at $126,000.
In all three cities, fewer than 2% of unit sales recorded a loss.
This shows that the frequency and severity of losses are very different measures.
In a rising market, the small number of owners who lose money may have overpaid, bought an unsuitable asset or been forced to sell before the property had enough time to grow.
A booming city cannot rescue every property. Asset selection and financial buffers remain critical.
Regional Australia continues to build wealth
Regional markets also performed strongly, with 97.6% of house resales and 96.9% of unit resales generating a profit.
Regional Queensland led the country, with a median house profit of $432,500 and a median unit profit of $321,000.
Regional New South Wales followed with gains of $370,000 for houses and $250,000 for units.
Longer holding periods, tight supply and strong post-pandemic price growth have supported these results.
However, regional markets are also becoming more fragmented.
Regional Northern Territory was the clear outlier, with only 81.7% of house resales and 74.1% of unit resales generating a profit.
This reinforces why investors should avoid treating “regional property” as a single market.
A large regional centre with diverse employment and population growth is very different from a small town dependent on one industry or employer.
Profits extend well beyond prestige suburbs
Domain’s analysis shows that profitable resales are not confined to expensive blue-chip locations.
Several middle-ring markets across Brisbane and Perth recorded 100% profitable house resales, including Carindale, North Lakes, Nundah, Fremantle and South Perth.
Sydney’s strongest areas for the proportion of profitable sales included Mount Druitt, Penrith and Camden, while Melbourne’s included Frankston, Sunbury and Cardinia.
This confirms that the recent cycle created wealth across the broader market.
Even so, the largest dollar gains remained concentrated in premium locations.
- Sydney’s Eastern Suburbs-North recorded a median house profit of $2.575 million, while Manly reached $2.15 million.
- Melbourne’s Boroondara exceeded $1 million,
- Brisbane Inner reached $1.107 million and
- Perth’s Cottesloe-Claremont recorded $1.43 million.
Affordable and middle-ring suburbs may offer a high probability of profit, while premium areas can generate much larger dollar gains because of their higher starting values, scarcity and deeper owner-occupier demand.
The bottom line
Australia’s profitability cycle may be showing its first signs of fatigue, but most homeowners remain in a strong position.
Record median gains, high rates of profitable sales and deep equity buffers mean the current softening is occurring after a prolonged period of wealth creation.
Some markets will face further pressure, particularly where affordability has reached its limits or where too much undifferentiated stock has been built.
Others will continue to benefit from population growth, limited supply and strong owner-occupier demand.
That divergence will make broad market forecasts less useful, but it will also create opportunities for investors who take a strategic, long-term approach.
Property markets have always moved in cycles and those who own quality assets, maintain adequate buffers and remain patient through the inevitable ups and downs are still likely to be rewarded.
The first cracks may have appeared, but Australia’s equity dividend remains firmly intact.
What this means for property investors
With our housing markets working their way through the downturn phase of the property cycle, there will likely be periods over the coming months where buyer competition eases in certain locations.
For strategic, long-term investors with their finances in order, that's often when the best opportunities present themselves, well before the broader market senses the recovery and the crowd returns, which is not likely to occur until inflation comes under control and interest rates start falling.
If you'd like help building a property strategy that can weather these conditions and take advantage of the opportunities they create, get in touch with our team at Metropole. We help our clients build, protect and pass on intergenerational wealth through strategic property advice, and we'd be happy to talk through how these latest figures might affect your own portfolio plans.
At Metropole, our wealth strategists take the time to understand where you are today, where you want to be, and whether your property, finance and wealth strategies are working together.
If you’d like greater clarity and a personalised roadmap for safely growing, protecting and eventually passing on your wealth, click here now and book a complimentary Wealth Discovery Chat with a Metropole Wealth Strategist.