


Key takeaways
Property price data since 2020 has been shaped by multiple one-off shocks: COVID, supply-chain ruptures, extreme interest rate swings, policy interventions, and a temporary migration freeze.
These factors distort growth rates and make short-term charts dangerous to rely on when assessing future performance.
The biggest driver of price growth wasn’t land value, but a jump in building costs, which pushed up replacement values and premiums for turnkey homes.
This artificially boosted growth in markets where the dwelling makes up most of the asset’s value. As costs have stabilised at permanently higher levels, it’s critical to strip this distortion out when analysing growth.
Over five years, APRA and RBA policy pushed borrowing power up, down, and sideways. This temporarily diverted investors into regions and smaller capitals.
But with the cash rate now near its long-term “neutral” range and credit rules unlikely to loosen, borrowing capacity today should be treated as the new normal — and history shows investment capital ultimately gravitates back to the big east-coast cities.
Record migration and the remote-work revolution tightened rental markets and drove a short-lived surge in regional demand. These forces are now normalising.
Investors need to recognise which markets benefited from temporary behavioural shifts, because many of those outliers are likely to go through mean reversion rather than repeat their past five-year performance.
The explosion of short-term data, dashboards, and borderless buyers’ agents creates a risk that investors make decisions based on distorted, unreliable five-year datasets.
In uncertain periods, deep local expertise and long-term (20+ year) trend analysis become far more reliable than algorithms or selective data points.
If you have been looking at property price data from the past five years, be careful.
This period has been shaped by a perfect storm of unique, one-off factors, and it does not necessarily reflect the long-term fundamentals that drive sustainable growth.
My concern is that some investors may rely on this recent data and draw the wrong conclusions.
Or worse, that property sellers and advisors might use it selectively to justify their recommendations.
It’s important to approach this data with caution and to interrogate it carefully to ensure it’s truly reliable and representative of long-term trends.

House building costs have increased by more than 40%
According to ABS data, home construction costs have risen by more than 40% since the start of Covid.
This has had two main effects on property prices.
Firstly, it’s pushed up the replacement cost of existing homes.
Normally, land appreciates while buildings depreciate. But over the past five years, both land and building values have increased, which is unusual.
Secondly, fully renovated homes have been in much higher demand. Most buyers have wanted to avoid the uncertainty and risk of construction cost blowouts, so they have paid a premium for turnkey homes.
As a result, properties that need significant capital investment have been less popular and typically experienced less growth. Again, this isn’t “normal”.
This trend has had a bigger impact in areas with lower land values. In these markets, land tends to make up a smaller share of the property’s total value.
Houses tend to be larger, often maximising the dwelling’s size by building close to the boundary with a small backyard.
That means rising construction costs would have had a proportionately larger influence on overall property values in these locations compared to land-rich locations.
Over the past two years, growth in construction costs has stabilised.
ABS producer price data shows costs have risen by just 1.35% p.a., which is well below the long-term pre-Covid average of around 5% p.a.
While the upward pressure has eased, it’s unlikely construction costs will fall. These elevated prices are now the “new normal.”
The key takeaway is this: when analysing property price growth over the past five years, it’s important to consider how much of that growth was simply driven by higher construction costs, not genuine increases in land value.
Stripping out this one-off structural shift hopefully gives you a clearer picture of the underlying, sustainable growth rate for a particular property or location.
Borrowing capacities have changed significantly
Borrowing capacity began to contract in 2017 when APRA started tightening credit policy, particularly by increasing borrowers’ living expense assumptions used by the banks.
In 2019, APRA went further and lifted the interest rate buffer from 2.0% to 2.5%.
At that time, the RBA cash rate was just 1.50%. So, while borrowers were adjusting to tighter credit rules, they were doing so in a very low-rate environment.
Then Covid hit.
The RBA slashed the cash rate to 0.10%, dramatically reducing borrowing costs and somewhat offsetting the impact of APRA’s tighter lending rules.
However, in 2021, APRA intervened again – this time increasing the interest rate buffer from 2.5% to 3.0%.
Since then, the RBA increased the cash rate to 4.35% which has a huge, negative effect on borrowing capacity.
Of course, the RBA eased the cash rate to 3.60% this year.
These swings in borrowing capacity would have had an uneven impact on property markets.
As borrowing power compressed, many buyers and investors were pushed towards more affordable regional markets and smaller capital cities.
The pandemic, lockdowns, and rise of WFH only amplified this shift.
Looking ahead, it seems unlikely that regulators will relax credit standards.
The RBA estimates that the “neutral” cash rate (a setting that is neither expansionary nor contractionary) sits between 3.0% and 3.5%. That means today’s borrowing capacity settings should be viewed as the new normal.
Historically, most investment dollars have flowed into major capital cities, and for good reason: strong demand and constrained supply continue to underpin long-term growth.
While the past five years have seen more investment directed toward regional areas and smaller capital cities due to borrowing capacity shocks, it’s worth asking whether this is a structural shift or a temporary one.
Some argue that as capital cities become less affordable, investors will inevitably look further afield.
But that argument has existed for decades.
The reality is that, over the long term, the majority of investment capital has always gravitated toward Australia’s largest cities.
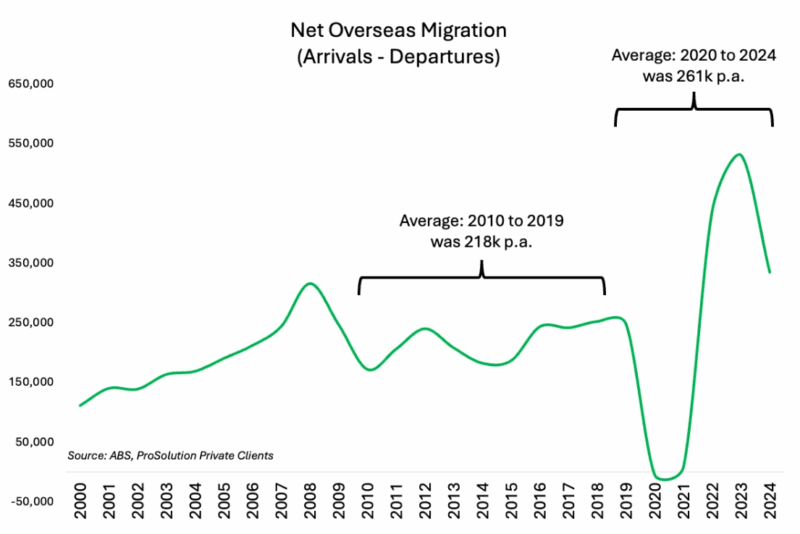
Overseas migration numbers have been volatile
There’s been a lot of discussion about the impact of overseas migration on Australia’s housing market.
During the pandemic, border closures caused a sharp fall in net overseas migration.
But since reopening, migration has rebounded strongly and is now sitting almost 20% above pre-pandemic levels.
Net overseas migration includes temporary visa holders (such as students), permanent migrants, and New Zealand citizens.
Around 60–70% of arrivals are on temporary visas.
- Also read:Melbourne property market forecast for 2026 & 2027 | Why the opportunity is bigger than it looks

- Also read:Sydney property market forecast for 2026 and 2027 | Why the short-term softness is a long-term opportunity

- Also read:Latest Property Price Forecasts. Australian Property Market Outlook 2026: Where To Now After The Rate Rise & Budget Changes.

- Also read:Brisbane Property Market Forecast [2026 & Beyond] – What The Olympics Decade Means for Investors.

- Also read:Adelaide housing market update | June 2026

Because temporary visa holders can generally only purchase newly built properties with FIRB approval, and often face difficulties obtaining finance, most are renters.
It’s therefore unsurprising that rental markets are extremely tight, with vacancy rates around 1% in many capital cities.
For context, a 3% vacancy rate is typically considered a balanced market.
According to Cotality, rents have risen by 4.3% in the year to September 2025.
Beyond the rental market, rising migration also influences economic growth and the employment landscape.
Almost 80% of net overseas migration is absorbed by Sydney, Melbourne, and Brisbane.
Given this, it’s somewhat surprising that Sydney and Melbourne have underperformed relative to other capital cities over the past two to three years.
Working from home became mainstream overnight
As we all know, lockdowns forced millions of Australians to work from home almost overnight.
Before the pandemic, remote work was often viewed with some scepticism – many questioned whether people were as productive at home as they were in the office.
But for many industries, that scepticism has largely disappeared, thanks to the pandemic experience.
Since the pandemic ended, working from home has remained a permanent feature of the employment landscape, although employers are now encouraging staff to spend more time in the office.
It’s fair to say the pendulum probably swung too far in favour of WFH and is now settling somewhere in the middle.
Melbourne is a notable outlier – the city is still much quieter on Mondays and Fridays.
The Victorian Government’s proposal to enshrine the right to work from home two days per week is unlikely to help the return-to-office movement or the recovery of city-based businesses.
The sudden shift to remote work gave employees a level of flexibility they had not previously enjoyed.
Without the need to commute five days a week, many people reconsidered where they lived, and demand for regional property surged as a result.
While recent higher interest rates have since dampened this trend, I expect migration from the cities to the regions will normalise to a much lower, more sustainable level.
When analysing property price growth over the past five years, it’s important to consider how the work-from-home phenomenon contributed to that growth.
Property prices don’t always fall significantly when they become overheated.
More often, they might fall a little, but mostly growth simply stalls for several years.
This is the law of mean reversion in action: periods of abnormal growth are always followed by slower ones.
In some locations, the last five years represent an outlier, and mean reversion may eventually do its work.
Interest rate shocks
Around five years ago, before the pandemic, home loan rates were already low by historical standards – typically between 3.0% and 3.5% p.a.
By late 2020, fixed home and investment loan rates had fallen to around 2% p.a., with variable rates sitting between 2.5% and 3% p.a.
In fact, by 2021, some fixed rates dipped below 2% p.a. – levels not seen before in modern lending history.
These ultra-low interest rates encouraged Australians to borrow more, and lending volumes surged, peaking in early 2022.
But then the party ended. By the end of 2023, home loan rates were two-and-a-half to three times higher than the previous year, typically above 6% p.a.
As I wrote recently, changes in the supply of credit (i.e., loan volumes) have a significant impact on property price growth.
Given the extreme volatility in interest rates over the past five years, especially with the RBA cash rate cut to virtually zero, it’s reasonable to expect that this period would have left a unique and lasting imprint on property price trends.
Be careful extrapolating data over the past 5 years
As you can see, Australia’s property markets have been influenced by a series of unique and, in many cases, unprecedented factors over the past five years.
For this reason, when assessing a property’s potential, focus on data that spans at least 20 years and captures a full cycle of interest rate and credit movements.
Five-year growth charts may look impressive, but they often reflect temporary distortions, not enduring fundamentals.
I should point out that there’s really no such thing as a “normal” market.
There are always unique events that distort the data – that’s actually what normal looks like.
However, what’s truly unusual about the past five years is the number of fundamental factors that have been significantly disrupted.
Beware the explosion of data-driven buyers’ agents
Investors should be cautious about the recent explosion in so-called data-driven, and often borderless, buyers’ agents.
I have written before that the real value of a buyers’ agent lies in their deep, local knowledge built up over many years, if not decades.
That’s what you’re paying for – their experience and understanding of the nuances that data alone can’t capture.
If a buyers’ agent is primarily relying on a data-driven approach, and if we agree that the data from the past five years may not be a reliable foundation for investment decisions, then this approach could lead to some very expensive investment mistakes.
Furthermore, I have also previously questioned the reliability and usability of property data itself.
And I’ll be expanding on this topic in a few weeks’ time.


