


Key takeaways
RBA rate cut in August has added fuel to already strong housing momentum, improving affordability and boosting buyer/seller confidence.
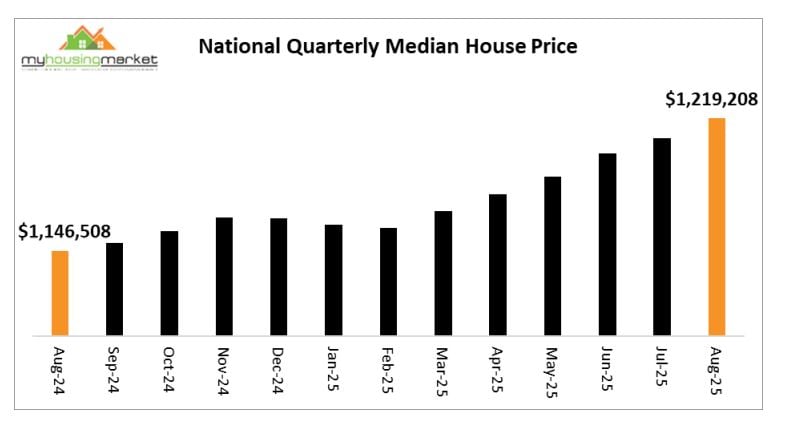
House prices rose nationally for the sixth consecutive month, up 0.9% for the quarter to a median of $1,219,208, now 6.3% higher year-on-year.
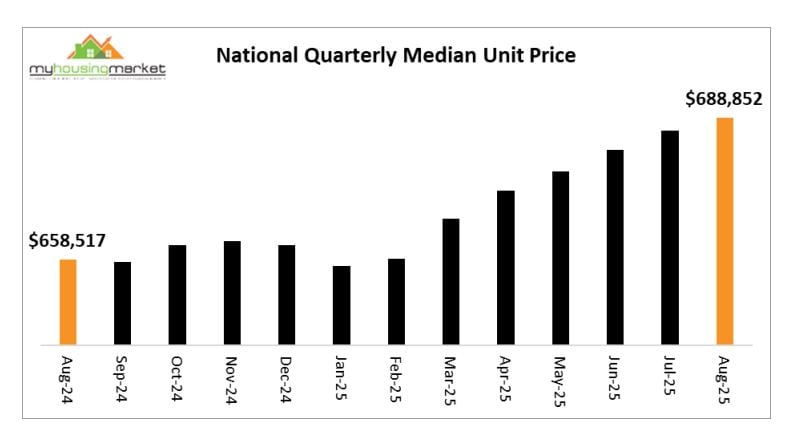
Unit prices also rose, marking their seventh straight monthly increase, up 0.6% to $688,852, 4.6% higher year-on-year.
Expect continued strong price growth, led by Brisbane, Perth, and Adelaide, likely exceeding 10% annually for both houses and units.
Another RBA rate cut possible in 2025 if inflation and labour markets allow, further boosting housing markets.
The widely anticipated decision by the RBA to cut official interest rates over August has added to momentum in already robust housing markets, with most capitals again reporting higher house prices over the August quarter compared to the previous July quarter.
The national capital city median house price increased by 0.9% over the August quarter to $1,219,208 compared to the July quarter, according to the latest data from My Housing Market.
The August result was the sixth consecutive monthly rise in national prices with annual house prices continuing to accelerate and now higher by 6.3% over the past year.

Most capitals reported house price increases over August with the resurgent Darwin again the top performer higher by 3.6% followed by Brisbane up 2.2%, Sydney higher by 1.4%, Adelaide up 0.8%, Perth increased 0.6%, Canberra higher by 0.2% with Melbourne and Hobart lower – down by 0.1% and 0.4% respectively.
Darwin, Brisbane and Perth have reported the highest house price increases over the past year - higher by 16.3%, 11.0% and 9.9% respectively.
Quarterly Median House Prices August 2025
| Median | Month | This Year | 1 Year | 2 Year | |
| Sydney | $1,729,426 | 1.4% | 4.5% | 5.9% | 12.5% |
| Melbourne | $1,082,701 | -0.1% | 3.0% | 3.1% | 1.7% |
| Brisbane | $1,085,235 | 2.2% | 8.1% | 11.0% | 29.1% |
| Adelaide | $1,025,066 | 0.8% | 5.2% | 6.7% | 25.1% |
| Perth | $1,020,282 | 0.6% | 5.4% | 9.9% | 39.9% |
| Hobart | $704,816 | -0.4% | 3.2% | 5.1% | 5.8% |
| Darwin | $710,799 | 3.6% | 13.6% | 16.3% | 8.6% |
| Canberra | $978,479 | 0.2% | 2.5% | 4.4% | 1.0% |
| National | $1,219,208 | 0.9% | 4.7% | 6.3% | 14.5% |
Apartment / Unit Market Update
National unit prices were also higher again over the August quarter for the seventh consecutive month, rising by 0.6% to $688,852 to remain 4.6% higher than the August quarter 2024 result.
Adelaide was the top monthly performer with unit prices rising over August by 2.2% followed by Brisbane up 1.8%, Canberra increased 0.9%, Perth higher by 0.8%, Melbourne up 0.7%, Darwin higher by 0.3% with Sydney lower by 0.1%.
Quarterly Median Unit Prices August 2025
| Median | Month | This Year | 1 Year | 2 Year | |
| Sydney | $796,938 | -0.1% | 2.7% | 2.8% | 7.3% |
| Melbourne | $576,839 | 0.7% | 2.8% | 1.9% | 3.1% |
| Brisbane | $636,598 | 1.8% | 10.8% | 15.6% | 44.5% |
| Adelaide | $586,579 | 2.2% | 11.4% | 12.3% | 35.8% |
| Perth | $564,118 | 0.8% | 10.0% | 14.3% | 46.7% |
| Hobart | $503,853 | -1.5% | -3.0% | -3.6% | -4.6% |
| Darwin | $372,772 | 0.3% | 4.3% | 2.9% | 1.4% |
| Canberra | $517,661 | 0.9% | 3.3% | 3.5% | 1.8% |
| National | $688,852 | 0.4% | 4.1% | 4.6% | 11.3% |
Brisbane, Perth and Adelaide have recorded clearly the highest annual unit price growth over the year ending the August quarter 2025 up by 15.6%, 14.3%, and 12.3% respectively.
Comment
Capital city housing markets have continued to report generally positive results over the August quarter with most capitals recording higher prices for both houses and units.
The RBA rate cut over August following the reductions of February and May, has added to rising housing market energy by again improving affordability and supporting already heady buyer and seller confidence.
House prices increased in most capitals over August with Brisbane the top performer of the major cities, and the Perth median house price continuing to exceed $1,000,000 - and closing in rapidly on Adelaide.
Annual house prices in a reviving Melbourne continue to accelerate and are now up 3.1%
Unit price growth also remained positive over August, although overall results were again marginally lower compared to houses over the month.
Similar to houses, Melbourne continues to report rising results, with unit prices up by 2.8% over 2025 so far – a similar result to Sydney.
The remainer of 2025 is set to continue to produce positive results for most capital city housing markets, fuelled by improved affordability and rising confidence generated by lower interest rates.
Prices growth in Brisbane, Adelaide and Perth is set to again lead capital city outcomes and likely exceed 10% annually for both houses and units.
Sydney will to continue to report solid to strong results, with the Melbourne market clearly reviving with 2025 prices growth likely to clearly exceed the 2024 results for both houses and units.
Underlying drivers continue to support housing market activity generally, with the August RBA rate cut likely to be followed by another in 2025 if inflation and labour market outcomes continue to support lower rates.
The national economy remains strong with jobless rates still low and participation rates high - and both enhanced by recent interest rate cuts.
The continued strong performance of retail sales also indicates positive consumer activity and confidence.
Although high post-COVID migration levels have eased recently, numbers remain strong and will add to chronic housing undersupply supporting high rents and low vacancy rates generally in capital city rental markets.
Following a period of easing, the latest data is reporting a general tightening of rental vacancy rates and rising tenant demand, with higher rents again likely to follow.
High rents and higher prices continue to provide clear incentives for first home buyers and investors chasing solid investment returns.
New government initiatives to support first home buyers will increase demand and act to place more upward pressure on prices.
Capital city housing markets generally recorded higher house and unit prices over 2003 and 2024, and have continued to mostly rise over August despite the usual distractions for winter market activity.
National home prices are set to record sturdy growth again over 2025 similar at least to the results of the previous two years supported by lower interest rates, a continuing strong economy and chronic low levels of new home construction.
- Also read:August House Prices Accelerate as Interest Rates Fall | Latest Housing Market Stats Dr. Andrew Wilson

- Also read:52 years of valid reasons not to invest

- Also read:Why Testamentary Trusts Aren’t Just for the Rich: A Guide to Safeguarding Your Legacy Introduction

- Also read:Why the ALP’s Grand Plan to Build 1.2 Million Homes Is Destined to Fail – A Reality Check

- Also read:Here’s how I’ll be investing in property in 2023


