

Property prices have soared around Australia at a time when wages growth has been minimal or nonexistent for many.
An analysis by the Real Estate Institute of Australia shows the proportion of income needed to meet loan repayments has jumped from about 27 per cent two decades ago to almost 36 per cent in June this year.
However, the current property boom has not been the worst time to be on the housing ladder, with an eye-watering 45.8 per cent of family income required to meet mortgage repayments in the post-mining boom era of September 2008.
But as property prices keep climbing, housing affordability looks set to continue to be an issue in the future if household incomes don’t increase the REIA analysis showing a decline in housing affordability, yet rental affordability remains stable.
REIA’s new report, Housing Affordability Report: the past 20 years, shows that at the start of the 21st century, the weighted average proportion of income required to meet loan repayments has increased from 27.2% to a staggering 35.7%.
REIA President, Adrian Kelly said while housing affordability is on the decline, it was least affordable back in September 2008 where 45.8% of income was required to service а loan however as property prices climb, it looks set to become а greater issue in the future.
“Go back two decades to March 2002, Australia was at its most affordable at 26.8% of family income required to meet repayments,” he said.

Мг. Kelly said that housing affordability has declined in most states and territories throughout Australia, with Tasmania having the largest decrease in housing affordability of 12.7 percentage points.
ln contrast, Western Australia had the smallest decline in housing affordability at 2.1 percentage points.
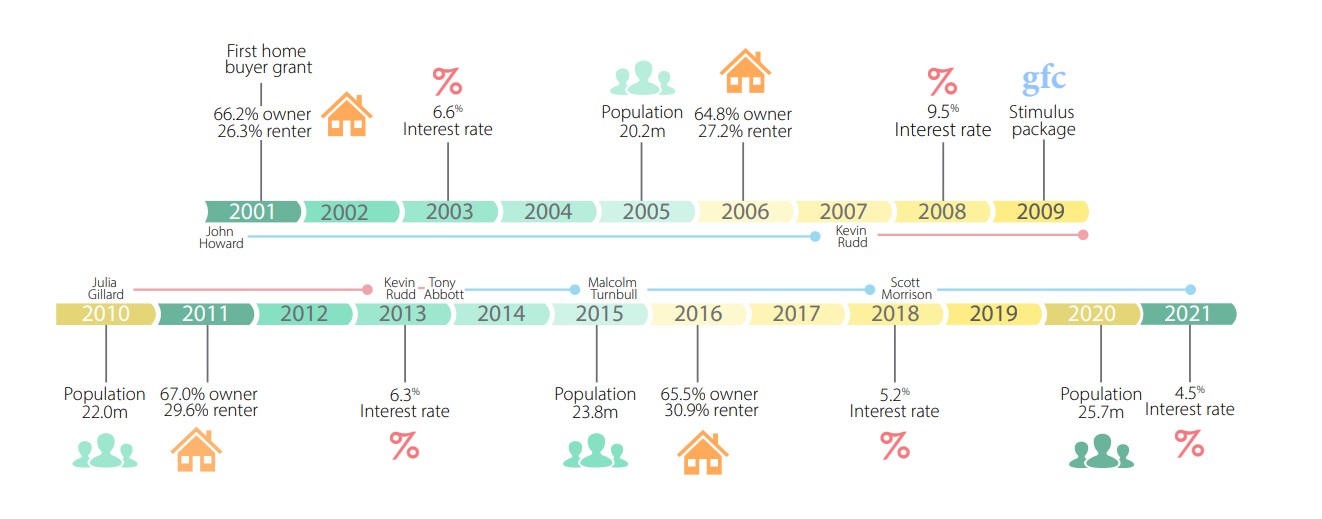
“The number of first home buyers was 25,782 in September of 2002 and increased bу 67.7 percentage points to 43,226 in June of 2021.
ln June of 2009, 50,098 first home buyers entered the market, the highest number during this time and 48.2% of all new loans.
ln contrast, March 2004 had the lowest number of entrants at around 17,250.
The number of first home buyers average loan increased bу а staggering 165.3%, from $169,789 to $450,467.
- Also read:This week’s Australian Property Market Update – Latest Data, State by State April 23rd 2024
- Also read:Latest property price forecasts for 2024 revealed. What’s ahead in our housing markets in the next year or two?
- Also read:Melbourne property market forecast for 2024
- Also read:Brisbane’s property market forecast for 2024
- Also read:Sydney property market forecast for 2024
Tasmania had the largest increase in average loan amounts to first home buyers of 303.0% while the Australian Capital Territory had the lowest increase of 145.8%.
However, if policy settings fail to change and without а boost to household disposable incomes through, for example, tax concessions for first home buyers, affordability is likely to get worse as interest rates rise,” he said.
ln June 2001 the cash rate target was 5.0% and, bу June 2021, it decreased to 0.1 %, its lowest rate а decline of 4.9 percentage points.
This is the lowest rate so far this century and lower than its height in 1990 of 17.5%.
The highest point the cash rate has been in the past 20 years was 7.3% in mid-2008,” he said.


Мг. Kelly said that over the past 20 years, the proportion of income required to meet loan repayments increased bу 8.5% from 27.2% to 35.7%.
Over the same period, family income increased bу 112.8% while the average home loan repayments increased bу 179.4%.
Average home loan amounts have increased from $157,239 to $548,323.

Rental Affordability
Rental affordability declined marginally over the past 20 years from 22.1% to 23.0% of family income, а marginal decrease of 0.9 percentage points.
Rental affordability was at its most affordable in December 2004 at 21.1 % and at its least affordable in March 2010 at 26.3%.
Tasmania had the largest decline in rental affordability of 9.0 percentage points.
Queensland and Victoria were the only states in which rental affordability improved.
Vacancy rates for Australia were at their tightest in March 2007 at 1.4% with the highest amount of vacant properties recorded in June 2004 at 3.8%,


